IBOV 167,810.01 ▼ 0.04% IPSA 10,976.50 ▼ 1.37% IPC MEX 65,860.95 ▲ 0.45% MERVAL 3,027,068 ▲ 0.15% COLCAP 2,429.93 ▲ 0.27% BVL PERÚ 58,737.38 ▲ 0.28% USD/BRL5.16▼ 0.02% USD/MXN17.05▼ 0.26% USD/CLP913.75▲ 0.01% USD/COP3,140▲ 0.03% USD/PEN3.36▼ 0.66% USD/ARS1,492▲ 0.08% USD/UYU40.27▲ 1.24% USD/PYG5,939▲ 1.68% USD/BOB11.65▼ 0.68% USD/DOP58.34▲ 1.25% USD/CRC445.92▲ 0.89% USD/GTQ7.62▲ 2.21% USD/HNL26.79▲ 1.57% USD/NIO36.62▲ 0.69% USD/VES762.44▼ 0.13% USD/PAB1.00— 0.00% USD/BZD2.00— 0.00% USD/JMD 157.28 — 0.00% USD/TTD6.70▲ 0.61% EUR/BRL5.95▲ 1.04% BRENT 88.88 ▼ 0.03% WTI 83.11 ▼ 0.11% IRON ORE 161.91 — — COPPER 6.61 ▲ 0.03% GOLD 4,461 ▲ 1.78% SILVER 65.59 ▲ 1.26% SOY 1,184 ▲ 3.20% CORN 480.50 ▲ 10.02% WHEAT 655.00 ▲ 3.93% COFFEE 317.25 ▼ 5.51% SUGAR 16.43 ▼ 1.79% ORANGE JUICE 138.55 ▼ 0.47% COTTON 85.03 ▲ 2.33% COCOA 5,719 ▲ 3.18% BEEF 223.60 ▼ 3.93% CATTLE 339.10 ▼ 3.16% LITHIUM 75.20 ▲ 1.47% PETR4 41.64 ▼ 0.05% VALE3 72.97 ▲ 0.83% ITUB4 38.60 ▼ 1.03% BBDC4 16.85 ▲ 0.36% ABEV3 14.89 ▼ 0.80% BBAS3 19.37 ▲ 0.47% B3SA3 14.26 ▼ 0.21% WEGE3 47.59 ▲ 0.49% PRIO3 59.14 ▼ 0.19% SUZB3 41.33 ▲ 2.35% RENT3 34.68 ▼ 0.09% AZZA3 15.89 ▼ 2.63% CSAN3 3.22 ▼ 1.83% RAIZ4 0.25 — 0.00% PCAR3 2.75 ▼ 0.36% GMAT3 3.65 ▼ 1.08% PSSA3 48.13 ▼ 0.54% CVCB3 1.33 ▼ 2.92% POSI3 3.36 ▲ 2.44% SLCE3 13.34 ▲ 0.30% NATU3 8.14 ▼ 0.73% BRKM5 5.64 — 0.00% RANI3 7.96 ▲ 0.76% CSNA3 4.30 ▲ 0.47% CMIN3 5.60 ▲ 0.54% USIM5 6.56 ▼ 0.91% GGBR4 24.69 ▲ 2.19% ENEV3 24.21 ▼ 1.38% CPFE3 43.24 ▼ 0.94% CMIG4 10.37 ▼ 0.29% EQTL3 35.56 ▼ 0.70% LREN3 11.87 ▼ 1.33% VIVT3 29.97 ▼ 0.56% RAIL3 13.00 ▲ 0.31% KLABIN 17.69 ▲ 0.80% RAIA DROGASIL 18.00 ▼ 1.53% RDOR3 32.41 ▼ 2.29% HAPV3 9.60 ▼ 1.94% FLRY3 18.24 ▲ 0.28% SMTO3 14.76 ▼ 1.67% UGPA3 30.87 ▼ 0.39% VBBR3 33.54 ▲ 0.93% BBSE3 37.39 ▲ 0.35% BPAC11 50.28 ▲ 0.30% CURY3 31.15 ▼ 1.11% AERI3 2.17 ▼ 3.98% VIVARA 21.12 ▲ 1.10% COMPASS 21.95 ▲ 1.01% VAMOS 2.85 ▲ 1.79% SANB11 29.49 ▼ 0.10% ASAI3 8.04 ▼ 0.50% SBSP3 26.21 ▲ 0.85% WALMEX 48.07 ▼ 0.62% GMEXICO 223.28 ▲ 0.35% FEMSA 201.19 ▼ 0.24% CEMEX 19.32 ▲ 0.89% GFNORTE 193.98 ▲ 1.18% BIMBO 60.98 ▼ 0.96% TELEVISA 9.71 ▲ 0.21% AMX 19.80 ▼ 0.95% GAP 366.23 ▲ 0.43% ASUR 275.04 ▲ 1.25% OMA 233.50 ▲ 0.62% KOF 188.04 ▲ 0.86% GRUMA 252.90 ▲ 0.11% KIMBER 39.74 ▲ 0.43% SQM-B 65,305 ▼ 0.84% COPEC 5,964 ▼ 1.09% BSANTANDER 78.37 ▼ 2.28% FALABELLA 6,334 ▼ 1.48% ENELAM 87.09 ▲ 0.10% CENCOSUD 1,946 ▼ 2.19% CMPC 1,020 ▼ 1.96% BANCO CHILE 184.96 ▼ 1.01% LATAM AIR 24.08 ▼ 1.11% YPF 7,810 ▲ 0.26% GGAL 6,980 ▼ 0.78% PAMPA 5,115 ▲ 0.69% TXAR 747.50 ▼ 2.35% ALUAR 938.00 ▼ 1.21% TGS 8,870 ▼ 0.17% CEPU 2,156 ▲ 1.84% MIRGOR 1,650 ▼ 1.20% COME 40.93 ▼ 0.73% LOMA NEGRA 3,130 ▲ 0.08% BYMA 275.00 ▼ 1.70% TELECOM ARG 4,233 ▼ 0.70% ECOPETROL 16.92 ▼ 0.53% BANCOLOMBIA 95.87 ▼ 2.18% GRUPO AVAL 5.40 ▲ 2.66% CREDICORP 375.17 ▼ 0.49% SOUTHERN COPPER 193.97 ▼ 0.26% BUENAVENTURA 34.45 ▼ 1.02% MERCADOLIBRE 1,870 ▼ 3.59% NUBANK 13.53 ▼ 0.92% XP 15.55 ▲ 0.26% PAGSEGURO 8.71 ▼ 2.08% STONE 9.95 ▼ 0.07% GLOBANT 38.10 ▼ 2.26% TECNOGLASS 42.30 ▼ 1.10% GAP AIRPORT 214.74 ▲ 0.54% ASUR 275.04 ▲ 1.25% OMA AIRPORT 109.26 ▲ 0.79% AMX ADR 23.38 ▼ 0.23% FEMSA ADR 117.91 ▼ 0.27% CEMEX ADR 11.29 ▲ 0.85% PETROBRAS ADR 17.92 ▼ 0.08% VALE ADR 14.49 ▲ 1.19% ITAU ADR 7.46 ▼ 0.53% SANTANDER BR 5.76 ▲ 0.09% AMBEV ADR 2.85 ▲ 0.18% CSN 0.86 ▼ 0.51% GERDAU 4.82 ▲ 2.67% LATAM ADR 52.62 ▼ 0.74% BTC 63,384 ▼ 0.26% ETH 1,886 ▲ 0.26% SOL 75.89 ▼ 0.40% XRP 1.01 ▼ 1.15% BNB 609.60 ▼ 1.12% ADA 0.18 ▼ 1.98% DOGE 0.07 ▼ 1.56% AVAX 6.38 ▲ 1.04% LINK 8.77 ▼ 0.06% DOT 0.78 ▼ 0.75% LTC 45.08 ▼ 0.85% BCH 213.85 ▲ 0.10% TRX 0.34 ▲ 0.28% XLM 0.16 ▼ 1.33% HBAR 0.07 ▼ 0.53% NEAR 1.65 ▲ 2.42% ATOM 1.40 ▼ 2.36% AAVE 89.06 ▲ 0.93% SELIC 14.00% EMBRAER 96.21 ▲ 4.03% EMBRAER ADR 74.72 ▲ 4.66% JBS 13.28 ▲ 1.96% JBS BDR 68.31 ▲ 1.91% MBRF3 16.79 ▲ 3.90% MBRFY 3.21 ▲ 8.08% INTER 5.10 ▼ 1.95% EGX 55,040 ▲ 0.38% USD/ZAR16.15▼ 0.36% USD/NGN1,359▼ 0.29% NIKKEI 67,524 ▲ 0.83% CSI300 4,691 ▲ 0.58% HSI 25,440 ▼ 0.83% NIFTY 24,436 ▼ 0.15% KOSPI 6,579 ▲ 3.68% JCI 6,374 ▲ 1.69% USD/JPY159.46▲ 0.11% USD/CNY6.73▼ 0.18% DAX 26,331 ▼ 0.23% CAC 8,675 ▼ 0.46% FTSE 10,833 ▼ 0.10% MIB 53,699 ▼ 0.01% IBEX 20,204 ▼ 0.05% STOXX 659.48 ▼ 0.16% EUR/USD1.15▼ 0.11% GBP/USD1.35▼ 0.10% SPX 7,751 ▲ 0.29% DJI 53,810 ▲ 0.03% NDX 29,799 ▲ 0.93% RUT 3,041 ▲ 0.46% TSX 36,619 ▲ 0.39% VIX 14.60 ▼ 4.45% USD/CAD1.39▲ 0.09% US10Y 4.6760 ▼ 0.17% IBOV 167,810.01 ▼ 0.04% IPSA 10,976.50 ▼ 1.37% IPC MEX 65,860.95 ▲ 0.45% MERVAL 3,027,068 ▲ 0.15% COLCAP 2,429.93 ▲ 0.27% BVL PERÚ 58,737.38 ▲ 0.28% USD/BRL 5.16 ▲ 0.01% USD/MXN 17.06 ▼ 0.24% USD/CLP 913.98 ▲ 0.04% USD/COP 3,140 ▲ 0.03% USD/PEN 3.36 ▼ 0.66% USD/ARS 1,493 ▲ 0.10% USD/UYU 40.27 ▲ 1.24% USD/PYG 5,939 ▲ 1.68% USD/BOB 11.64 ▼ 0.76% USD/DOP 58.34 ▲ 1.25% USD/CRC 445.92 ▲ 0.89% USD/GTQ 7.62 ▲ 2.21% USD/HNL 26.79 ▲ 1.57% USD/NIO 36.62 ▲ 0.69% USD/VES 762.44 ▼ 0.13% USD/PAB 1.00 — 0.00% USD/BZD 2.00 — 0.00% USD/JMD 157.28 — 0.00% USD/TTD 6.70 ▲ 0.61% EUR/BRL 5.95 ▲ 1.01% BRENT 88.88 ▼ 0.03% WTI 83.11 ▼ 0.11% IRON ORE 161.91 — — COPPER 6.61 ▲ 0.03% GOLD 4,461 ▲ 1.78% SILVER 65.59 ▲ 1.26% SOY 1,184 ▲ 3.20% CORN 480.50 ▲ 10.02% WHEAT 655.00 ▲ 3.93% COFFEE 317.25 ▼ 5.51% SUGAR 16.43 ▼ 1.79% ORANGE JUICE 138.55 ▼ 0.47% COTTON 85.03 ▲ 2.33% COCOA 5,719 ▲ 3.18% BEEF 223.60 ▼ 3.93% CATTLE 339.10 ▼ 3.16% LITHIUM 75.20 ▲ 1.47% PETR4 41.64 ▼ 0.05% VALE3 72.97 ▲ 0.83% ITUB4 38.60 ▼ 1.03% BBDC4 16.85 ▲ 0.36% ABEV3 14.89 ▼ 0.80% BBAS3 19.37 ▲ 0.47% B3SA3 14.26 ▼ 0.21% WEGE3 47.59 ▲ 0.49% PRIO3 59.14 ▼ 0.19% SUZB3 41.33 ▲ 2.35% RENT3 34.68 ▼ 0.09% AZZA3 15.89 ▼ 2.63% CSAN3 3.22 ▼ 1.83% RAIZ4 0.25 — 0.00% PCAR3 2.75 ▼ 0.36% GMAT3 3.65 ▼ 1.08% PSSA3 48.13 ▼ 0.54% CVCB3 1.33 ▼ 2.92% POSI3 3.36 ▲ 2.44% SLCE3 13.34 ▲ 0.30% NATU3 8.14 ▼ 0.73% BRKM5 5.64 — 0.00% RANI3 7.96 ▲ 0.76% CSNA3 4.30 ▲ 0.47% CMIN3 5.60 ▲ 0.54% USIM5 6.56 ▼ 0.91% GGBR4 24.69 ▲ 2.19% ENEV3 24.21 ▼ 1.38% CPFE3 43.24 ▼ 0.94% CMIG4 10.37 ▼ 0.29% EQTL3 35.56 ▼ 0.70% LREN3 11.87 ▼ 1.33% VIVT3 29.97 ▼ 0.56% RAIL3 13.00 ▲ 0.31% KLABIN 17.69 ▲ 0.80% RAIA DROGASIL 18.00 ▼ 1.53% RDOR3 32.41 ▼ 2.29% HAPV3 9.60 ▼ 1.94% FLRY3 18.24 ▲ 0.28% SMTO3 14.76 ▼ 1.67% UGPA3 30.87 ▼ 0.39% VBBR3 33.54 ▲ 0.93% BBSE3 37.39 ▲ 0.35% BPAC11 50.28 ▲ 0.30% CURY3 31.15 ▼ 1.11% AERI3 2.17 ▼ 3.98% VIVARA 21.12 ▲ 1.10% COMPASS 21.95 ▲ 1.01% VAMOS 2.85 ▲ 1.79% SANB11 29.49 ▼ 0.10% ASAI3 8.04 ▼ 0.50% SBSP3 26.21 ▲ 0.85% WALMEX 48.07 ▼ 0.62% GMEXICO 223.28 ▲ 0.35% FEMSA 201.19 ▼ 0.24% CEMEX 19.32 ▲ 0.89% GFNORTE 193.98 ▲ 1.18% BIMBO 60.98 ▼ 0.96% TELEVISA 9.71 ▲ 0.21% AMX 19.80 ▼ 0.95% GAP 366.23 ▲ 0.43% ASUR 275.04 ▲ 1.25% OMA 233.50 ▲ 0.62% KOF 188.04 ▲ 0.86% GRUMA 252.90 ▲ 0.11% KIMBER 39.74 ▲ 0.43% SQM-B 65,305 ▼ 0.84% COPEC 5,964 ▼ 1.09% BSANTANDER 78.37 ▼ 2.28% FALABELLA 6,334 ▼ 1.48% ENELAM 87.09 ▲ 0.10% CENCOSUD 1,946 ▼ 2.19% CMPC 1,020 ▼ 1.96% BANCO CHILE 184.96 ▼ 1.01% LATAM AIR 24.08 ▼ 1.11% YPF 7,810 ▲ 0.26% GGAL 6,980 ▼ 0.78% PAMPA 5,115 ▲ 0.69% TXAR 747.50 ▼ 2.35% ALUAR 938.00 ▼ 1.21% TGS 8,870 ▼ 0.17% CEPU 2,156 ▲ 1.84% MIRGOR 1,650 ▼ 1.20% COME 40.93 ▼ 0.73% LOMA NEGRA 3,130 ▲ 0.08% BYMA 275.00 ▼ 1.70% TELECOM ARG 4,233 ▼ 0.70% ECOPETROL 16.92 ▼ 0.53% BANCOLOMBIA 95.87 ▼ 2.18% GRUPO AVAL 5.40 ▲ 2.66% CREDICORP 375.17 ▼ 0.49% SOUTHERN COPPER 193.97 ▼ 0.26% BUENAVENTURA 34.45 ▼ 1.02% MERCADOLIBRE 1,870 ▼ 3.59% NUBANK 13.53 ▼ 0.92% XP 15.55 ▲ 0.26% PAGSEGURO 8.71 ▼ 2.08% STONE 9.95 ▼ 0.07% GLOBANT 38.10 ▼ 2.26% TECNOGLASS 42.30 ▼ 1.10% GAP AIRPORT 214.74 ▲ 0.54% ASUR 275.04 ▲ 1.25% OMA AIRPORT 109.26 ▲ 0.79% AMX ADR 23.38 ▼ 0.23% FEMSA ADR 117.91 ▼ 0.27% CEMEX ADR 11.29 ▲ 0.85% PETROBRAS ADR 17.92 ▼ 0.08% VALE ADR 14.49 ▲ 1.19% ITAU ADR 7.46 ▼ 0.53% SANTANDER BR 5.76 ▲ 0.09% AMBEV ADR 2.85 ▲ 0.18% CSN 0.86 ▼ 0.51% GERDAU 4.82 ▲ 2.67% LATAM ADR 52.62 ▼ 0.74% BTC 63,384 ▼ 0.26% ETH 1,886 ▲ 0.26% SOL 75.89 ▼ 0.40% XRP 1.01 ▼ 1.15% BNB 609.60 ▼ 1.12% ADA 0.18 ▼ 1.98% DOGE 0.07 ▼ 1.56% AVAX 6.38 ▲ 1.04% LINK 8.77 ▼ 0.06% DOT 0.78 ▼ 0.75% LTC 45.08 ▼ 0.85% BCH 213.85 ▲ 0.10% TRX 0.34 ▲ 0.28% XLM 0.16 ▼ 1.33% HBAR 0.07 ▼ 0.53% NEAR 1.65 ▲ 2.42% ATOM 1.40 ▼ 2.36% AAVE 89.06 ▲ 0.93% SELIC 14.00% EMBRAER 96.21 ▲ 4.03% EMBRAER ADR 74.72 ▲ 4.66% JBS 13.28 ▲ 1.96% JBS BDR 68.31 ▲ 1.91% MBRF3 16.79 ▲ 3.90% MBRFY 3.21 ▲ 8.08% INTER 5.10 ▼ 1.95% EGX 55,040 ▲ 0.38% USD/ZAR 16.16 ▼ 0.28% USD/NGN 1,359 ▼ 0.08% NIKKEI 67,524 ▲ 0.83% CSI300 4,691 ▲ 0.58% HSI 25,440 ▼ 0.83% NIFTY 24,436 ▼ 0.15% KOSPI 6,579 ▲ 3.68% JCI 6,374 ▲ 1.69% USD/JPY 159.54 ▲ 0.17% USD/CNY 6.7330 ▼ 0.05% DAX 26,331 ▼ 0.23% CAC 8,675 ▼ 0.46% FTSE 10,833 ▼ 0.10% MIB 53,699 ▼ 0.01% IBEX 20,204 ▼ 0.05% STOXX 659.48 ▼ 0.16% EUR/USD 1.1523 ▼ 0.20% GBP/USD 1.3491 ▼ 0.10% SPX 7,751 ▲ 0.29% DJI 53,810 ▲ 0.03% NDX 29,799 ▲ 0.93% RUT 3,041 ▲ 0.46% TSX 36,619 ▲ 0.39% VIX 14.60 ▼ 4.45% USD/CAD 1.3945 ▲ 0.15% US10Y 4.6760 ▼ 0.17%
since 2009
Wednesday, August 12, 2026

Brazil Economy

Brazil Native Vegetation Cover Declines 14 Points in 41 Years, MapBiomas Data Show

By · August 12, 2026 · 6 min read

Daily Brief

The morning intel from across Latin America. Free.

By subscribing you agree to our privacy policy. We never share your email.

Brazil · Environment

Key Facts

  • Baseline cover 79% of Brazil’s territory in 1985, according to MapBiomas
  • Current cover 65% of territory in 2025, according to the same data
  • Timeframe 41-year annual land-use series from 1985 to 2025
  • Amazon loss 53.9 million hectares of native vegetation lost in absolute terms
  • Cerrado loss 51.7 million hectares lost, equal to a 34% reduction within the biome
  • State gain Rio de Janeiro was the only state with a net gain, at +1%
  • Conversion rate 56% of changed area shifted from native vegetation to agricultural use

The Cerrado and Pampa biomes lost roughly one-third of their native cover within their territories.
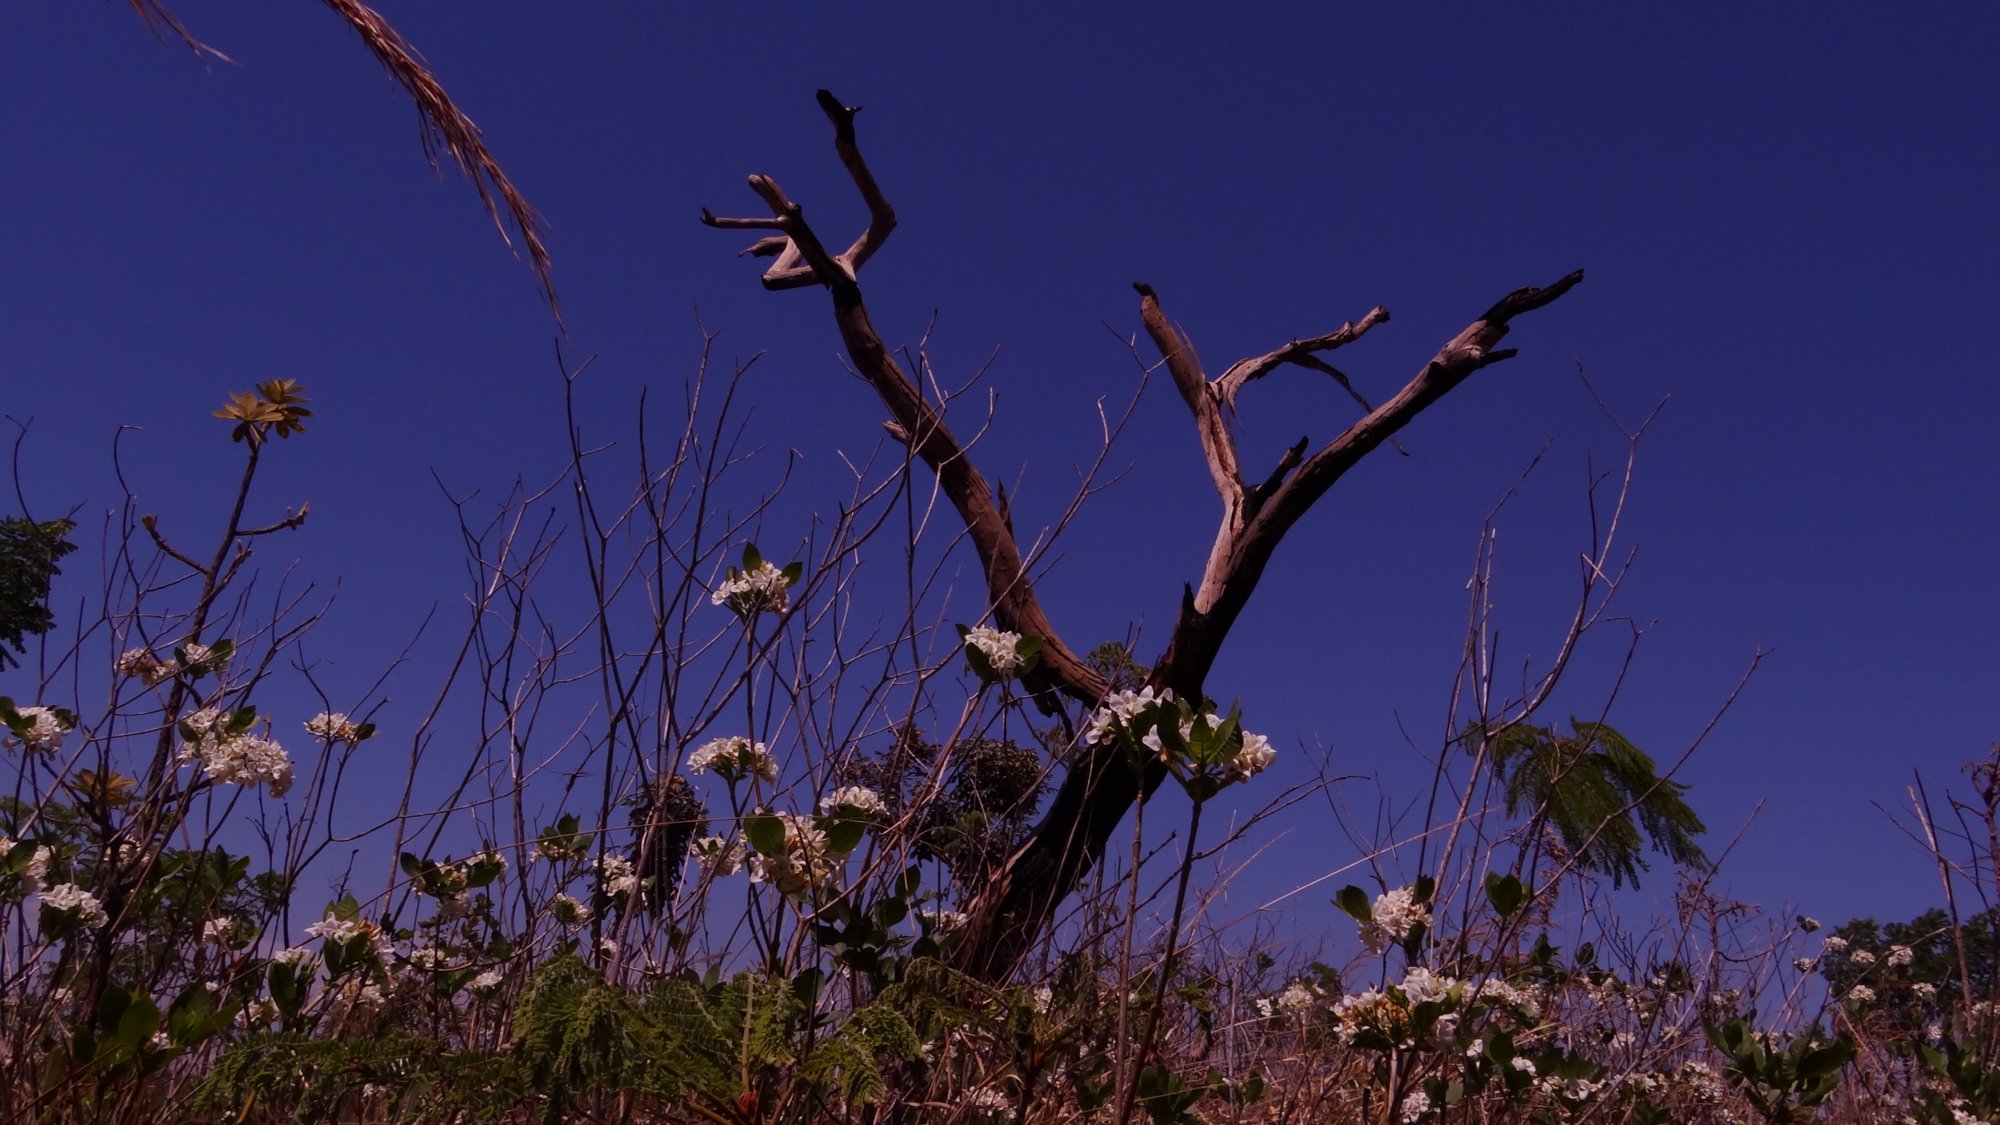
Aerial view of deforestation at a Brazil native vegetation boundary in the Cerrado biome
Flowers of the Brazilian Cerrado. Mapbiomas says Brazil lost 14% of its native vegetation over 40 years. (Photo: Jânio Muniz, CC BY-SA 4.0, Wikimedia Commons.)
One-stop reference
Company Intelligence
Every listed company in Latin America — financials, ownership and structure for 1,450+ companies across 26 exchanges, in one place.
Browse the directory →
RT
Ask Rio Times
Latin American markets, currencies and companies.
Open the full Ask Rio Times →

Brazil native vegetation cover has fallen from 79% to 65% of the country in 41 years. MapBiomas data show this 14-point drop, with every biome losing ground.

native vegetation: MapBiomas measures 41 years of land-cover change

Brazil native vegetation loss was documented in the new MapBiomas collection of annual land-cover data. The satellite-based series runs from 1985 through 2025, covering 41 years of land-use change.

The dataset compares the 1985 baseline with 2025 conditions for all Brazilian biomes. Results are expressed as territorial share and hectares converted, not as a sample survey.

MapBiomas is a collaborative network that includes universities, NGOs, and technology companies. It processes satellite images to generate annual land-use maps for the entire country.

The 2025 collection is the latest in a series that has tracked land-use dynamics since the mid-1980s. Each edition refines classification algorithms using new satellite data and field validation.

According to the project’s methodology, all mapping units are cross-checked against reference samples. This approach ensures consistency across biomes and states.

The findings were first reported by G1 and Poder360, which had access to the full dataset. The new collection includes both national and biome-level breakdowns for every year in the series.

Brazil’s National Institute for Space Research (INPE) operates independent deforestation monitoring, but MapBiomas provides a complementary full land-use perspective. The data are widely used by policymakers and researchers.

Amazon and Cerrado lead absolute vegetation loss

The Amazon lost 53.9 million hectares of native vegetation, the largest absolute loss. The Cerrado followed with 51.7 million hectares lost, according to the report.

The Caatinga lost 10.1 million hectares, while the Mata Atlântica lost 4.9 million hectares. The Pampa lost 4.0 million hectares over the same period.

These absolute figures highlight the scale of conversion in Brazil’s two largest biomes. The Amazon alone accounts for more than half of the total national area lost.

The Cerrado loss occurred mainly in the Matopiba region, an agricultural frontier spanning Maranhão, Tocantins, Piauí, and Bahia. That area is a major producer of soybeans and cotton.

In the Amazon, deforestation has been linked to cattle ranching and land speculation. The rate of loss has fluctuated with enforcement and commodity prices over the decades.

The Caatinga, a semi-arid biome, lost 10.1 million hectares, largely due to fuelwood extraction and overgrazing. The Mata Atlântica’s loss was driven by urban expansion and small-scale agriculture.

The Pampa, a grassland biome in the south, lost 4.0 million hectares, primarily to soybean cultivation and eucalyptus plantations. These changes affect biodiversity and soil stability.

Cerrado and Pampa suffer highest proportional losses

In proportional terms, the Cerrado saw a 34% reduction in its native vegetation area. The Pampa shrank by 32% within its own territory.

The Mata Atlântica retains the smallest proportion of native cover at 32% in 2025. Across Brazil, 25 states plus the Federal District reduced their native vegetation share.

Its loss affects water regulation, as the biome feeds major river basins. The Pampa’s 32% loss is notable because it is a temperate grassland with relatively few remaining natural areas.

Conversion to annual crops has fragmented the landscape. The Mata Atlântica, despite being the most degraded, still holds critical forest fragments that support endangered species like the lion tamarin.

Conservation efforts have slowed but not reversed loss. Only Rio de Janeiro, located within the Mata Atlântica, managed to increase its natural cover, due to reforestation projects and land-use planning.

The state’s gain, at +1%, is modest but significant. The Caatinga has 61%, and the Pampa has 36%.

Agricultural conversion drives recorded land-use shifts

About one third of Brazil experienced at least one land-cover change in the 41-year period. A total of 241 million hectares changed classification between 1985 and 2025.

For 56% of that converted area, native vegetation gave way to agricultural uses. Agricultural expansion, particularly for soybeans, corn, and cattle pasture, is the primary driver.

Brazil is now the world’s largest exporter of soybeans and beef. Pasture expansion accounts for the largest share of converted land, especially in the Amazon and Cerrado.

The remaining 44% of converted area includes urban growth, mining, and infrastructure. These uses are concentrated in the Mata Atlântica and along the coast.

The data also show that natural regeneration occurred in some areas, such as abandoned pastures, but at a much smaller scale. Regeneration did not offset losses.

MapBiomas attributes the national decline to a combination of highway construction, settlement projects, and global commodity demand. These factors have historically driven the agricultural frontier westward.

Rio de Janeiro posts only net gain across states

Rio de Janeiro was the only state to record a net gain in native vegetation share, at +1%. The gain stands in contrast to the national downward trend.

National coverage declined by 14 percentage points overall during the series. The MapBiomas dataset is the single primary source for these land-cover figures.

Rio de Janeiro’s gain is attributed to the recovery of Atlantic Forest in protected areas and on steep slopes. The state has enacted stricter environmental laws since the 1990s.

The state’s success may also reflect the high level of previous degradation; with less forest left, regrowth is more measurable. Still, the +1% is the only positive result in Brazil.

These are all in the Amazon, where deforestation pressure remains high. In the south, Rio Grande do Sul, which includes the Pampa, lost 11 points.

The Cerrado states of Goiás, Mato Grosso do Sul, and Minas Gerais each lost between 15 and 20 points. This loss has global implications for climate and biodiversity.

Frequently Asked Questions

What period does the MapBiomas vegetation data cover?

The data cover 41 years, from 1985 to 2025. That period is the full length of the annual land-cover series.

Which Brazilian biome lost the most vegetation in absolute terms?

The Amazon lost the most in absolute terms, with 53.9 million hectares. The Cerrado was second with 51.7 million hectares lost.

Was Brazil’s native vegetation loss uniform across all states?

No, 25 states and the Federal District reduced their native cover. Only Rio de Janeiro recorded a net gain, at +1%.

How is the native vegetation figure measured?

MapBiomas used satellite-based annual land-cover classification. The measurement compares territorial share and hectares between the 1985 baseline and 2025.

Sources: G1, Poder360, RTÉ

This article was produced by The Rio Times’ automated newsroom system. How we use AI · Report an error

Read More from The Rio Times

The Rio Times · Power Map
See who really holds power in Latin America
Click to open the Power Map

Rotate for Best Experience

This report is optimized for landscape viewing. Rotate your phone for the full experience.