Average Brazilian Monthly Household Spending 45.3 Percent Lower in Rural Areas Than in Urban
RIO DE JANEIRO, BRAZIL – “There is a higher level of spending in urban areas than in rural areas. The average family expenditure in an urban area is almost double that in a rural area,” the POF study manager, André Martins, told Agência Brasil.
The average total monthly expenditure of Brazilian families reached R$4,649.03 (US$1.162) in the two-year period. In urban areas, the average total expenditure was R$4,985.39, an increase of 7.2 percent compared to the national figure, while in the rural area the amount of expenditure reached R$2,543.15, which is 45.3 percent lower than the urban average expenditure.

The IBGE classifies expenses in three groups: current, increase in assets and decrease in liabilities.
Current expenditures concentrate the highest percentage of expenditures (92.7 percent) and form two groups: consumption expenditures, which are day-to-day expenses and correspond to 81 percent of total expenses; and other current obligations (taxes, labor contributions, banking services, pensions, allowances, and donations).
The survey shows stability in consumer spending in relation to the 2002/2003 survey when it represented 84.2 percent of the total expenditure.
Most representative
Within the group of consumer spending segments, housing (36.6 percent), transportatiion (18.1 percent) and food (17.5 percent) are most representative.
“Transportation, in this survey, won second place, followed by food in the third plan. Together, the three segments account for much of the consumer spending.”
“The other sectors share the remainder,” he said. Health care, for instance, has an eight percent share and education has a 4.7 percent share. Health care has had a growing share since the National Study of Family Expenditure (ENDEF) 1974/1975 when it totaled 4.1 percent.
In the urban area, the distribution of consumer expenses shows the same position, with housing in the leadership (37.1 percent), transportation (17.9 percent) and food (16.9 percent).
On the other hand, in the rural area, although habitation is still in first place (30,9 percent), transportion loses the second position (20 percent) to food, with a 23,8 percent share.
Regrettably, smoking-related consumer expenses still account for 0.5 percent of the 2017/2018 study, according to the researcher. “I wanted to see a zero percent share, but apparently it isn’t so yet,” he said.
With respect to other current expenses, which “cover everything you actually have to pay, but is not consumption”, including taxes, the study shows a significant increase between the 1974/1975 ENDEF and the survey released yesterday, going from 5.3 percent to 11.7 percent.
Food outside the home
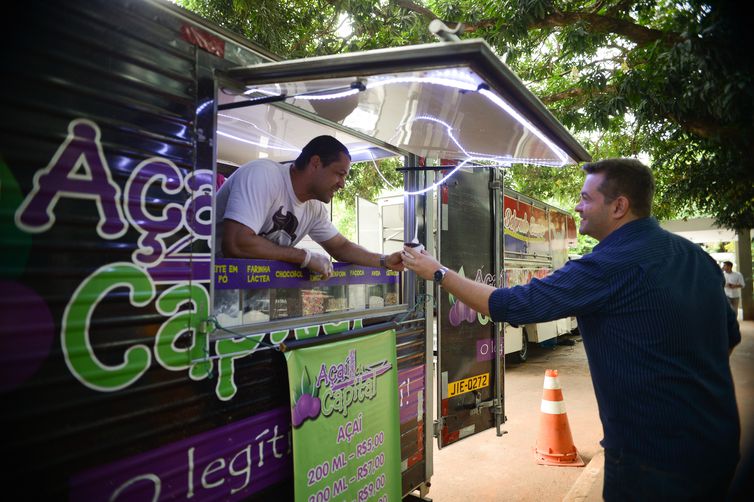
The 2002/2003 research had already observed a relevant share of out-of-home food in Brazilian family spending. Analyzing food expenses, the 2017/2018 POF points out that one-third of these expenses are dedicated to paying for food outside the home.
These are products that families buy to consume out of their homes. “It’s a snack, a dinner at the restaurant, a sandwich, it’s popcorn that they buy at the bus stop”.
This phenomenon is most striking in the urban area. André Martins added that this expense with food outside the home has increased over time. In 2002/2003, it accounted for 24.1 percent of food expenditure; in 2008/2009, it was 31.1 percent. Now, it is 32.8 percent.
In urban areas, these expenses with food outside the home have increased from 25.7 percent in 2002 to 33.9 percent in the study released yesterday, and with stability compared to the 2008 survey (33.1 percent). In the rural area, on the other hand, they increased from 13.1 percent to 24 percent.
Although food outside the home has remained stable in Brazil in recent years, the IBGE reported that, in regional terms, the Northeast, the Midwest, and the South have shown significant expansion in this type of spending, going from 23.5 percent, 30.1 percent and 27.7 percent in the previous research to 32.3 percent, 38 percent and 31.1 percent in the current one, respectively.
In the Southeast, on the other hand, it “shrank slightly” (from 37.2 percent to 34.2 percent), which can be explained by the “hardship” caused by the economic crisis. “There was a halt in eating out because it is a little more expensive,” said the researcher.
In the food at the home item, the current survey shows that the group of products composed of meat, poultry, and fish continues to lead the average monthly family spending, with 20.2 percent of the total, with greater weight in the North Region (27.1 percent) and lower in the Southeast (18.1 percent).
This group of products shows a drop in comparison to the previous study when it reached 21.9 percent of spending.
Associated products
Products associated with meal preparation, such as cereals, legumes, and oilseeds, reduced expenses from 10.4 percent in 2002 to eight percent in 2008, and to five percent in the most recent survey.
“Some basic foods (rice and beans, for instance) have decreased their share in household food, and there is space left for products associated with fast food and snacks.
One example is vegetables used in salads, which have increased from 3 percent (in 2002/2003) to 3.6 percent now; and fruits, which have increased from 4.2 percent to 5.2 percent in the same comparison.
Similarly, beverages and infusions showed an increase: from 8.5 percent in 2002 to 10.6 percent in 2017/2018.
“That which may be associated with fast food does not decrease; and that which is associated with formal food, in the sense of making food, has been decreasing. You see that oil and fats decrease (from 3.4 percent in 2002/2003 to 1.7 percent in 2017/2018,” he said.
André Martins also pointed out that 18 percent of family expenditures are non-monetary. This means the products are obtained by the family without needing to disburse money.
An example of this is the medication obtained free of charge from the Unified Health System (SUS), referenced in the health care section as a donation. Considering total expenditures, it appears that 15 percent are purchases that families made without having to pay.
Source: Agência Brasil
More: Brazil news in English, every day from The Rio Times.
Editorial responsibility: Matthias Camenzind, Editor-in-Chief · Editorial standards · Report an error