IBOV 171,031.73 ▲ 1.85% IPSA 11,338.38 ▲ 0.89% IPC MEX 65,729.18 ▲ 2.14% MERVAL 2,913,184 ▲ 1.30% COLCAP 2,459.23 ▲ 0.61% BVL PERÚ 58,698.13 ▲ 2.60% USD/BRL5.14▼ 0.14% USD/MXN16.95▲ 0.30% USD/CLP914.28— 0.00% USD/COP3,038▼ 1.18% USD/PEN3.35▼ 0.06% USD/ARS1,499▲ 0.12% USD/UYU40.20▲ 1.58% USD/PYG5,996▲ 1.55% USD/BOB11.43▲ 0.41% USD/DOP58.82▲ 0.20% USD/CRC450.05▲ 3.34% USD/GTQ7.62▲ 2.21% USD/HNL26.81▲ 0.31% USD/NIO36.62▲ 0.61% USD/VES778.00▼ 0.13% USD/PAB1.00— 0.00% USD/BZD2.00— 0.00% USD/JMD 157.28 — 0.00% USD/TTD6.71▲ 0.79% EUR/BRL6.00▼ 0.64% BRENT 88.88 ▼ 0.03% WTI 83.11 ▼ 0.11% IRON ORE 161.91 — — COPPER 6.61 ▲ 0.03% GOLD 4,461 ▲ 1.78% SILVER 65.59 ▲ 1.26% SOY 1,184 ▲ 3.20% CORN 480.50 ▲ 10.02% WHEAT 655.00 ▲ 3.93% COFFEE 317.25 ▼ 5.51% SUGAR 16.43 ▼ 1.79% ORANGE JUICE 138.55 ▼ 0.47% COTTON 85.03 ▲ 2.33% COCOA 5,719 ▲ 3.18% BEEF 223.60 ▼ 3.93% CATTLE 339.10 ▼ 3.16% LITHIUM 75.20 ▲ 1.47% PETR4 41.64 ▼ 0.05% VALE3 72.97 ▲ 0.83% ITUB4 38.60 ▼ 1.03% BBDC4 16.85 ▲ 0.36% ABEV3 14.89 ▼ 0.80% BBAS3 19.37 ▲ 0.47% B3SA3 14.26 ▼ 0.21% WEGE3 47.59 ▲ 0.49% PRIO3 59.14 ▼ 0.19% SUZB3 41.33 ▲ 2.35% RENT3 34.68 ▼ 0.09% AZZA3 15.89 ▼ 2.63% CSAN3 3.22 ▼ 1.83% RAIZ4 0.25 — 0.00% PCAR3 2.75 ▼ 0.36% GMAT3 3.65 ▼ 1.08% PSSA3 48.13 ▼ 0.54% CVCB3 1.33 ▼ 2.92% POSI3 3.36 ▲ 2.44% SLCE3 13.34 ▲ 0.30% NATU3 8.14 ▼ 0.73% IBOV 171,031.73 ▲ 1.85% IPSA 11,338.38 ▲ 0.89% IPC MEX 65,729.18 ▲ 2.14% MERVAL 2,913,184 ▲ 1.30% COLCAP 2,459.23 ▲ 0.61% BVL PERÚ 58,698.13 ▲ 2.60% USD/BRL 5.16 ▲ 0.01% USD/MXN 17.06 ▼ 0.24% USD/CLP 913.98 ▲ 0.04% USD/COP 3,140 ▲ 0.03% USD/PEN 3.36 ▼ 0.66% USD/ARS 1,493 ▲ 0.10% USD/UYU 40.27 ▲ 1.24% USD/PYG 5,939 ▲ 1.68% USD/BOB 11.64 ▼ 0.76% USD/DOP 58.34 ▲ 1.25% USD/CRC 445.92 ▲ 0.89% USD/GTQ 7.62 ▲ 2.21% USD/HNL 26.79 ▲ 1.57% USD/NIO 36.62 ▲ 0.69% USD/VES 762.44 ▼ 0.13% USD/PAB 1.00 — 0.00% USD/BZD 2.00 — 0.00% USD/JMD 157.28 — 0.00% USD/TTD 6.70 ▲ 0.61% EUR/BRL 5.95 ▲ 1.01% BRENT 88.88 ▼ 0.03% WTI 83.11 ▼ 0.11% IRON ORE 161.91 — — COPPER 6.61 ▲ 0.03% GOLD 4,461 ▲ 1.78% SILVER 65.59 ▲ 1.26% SOY 1,184 ▲ 3.20% CORN 480.50 ▲ 10.02% WHEAT 655.00 ▲ 3.93% COFFEE 317.25 ▼ 5.51% SUGAR 16.43 ▼ 1.79% ORANGE JUICE 138.55 ▼ 0.47% COTTON 85.03 ▲ 2.33% COCOA 5,719 ▲ 3.18% BEEF 223.60 ▼ 3.93% CATTLE 339.10 ▼ 3.16% LITHIUM 75.20 ▲ 1.47% PETR4 41.64 ▼ 0.05% VALE3 72.97 ▲ 0.83% ITUB4 38.60 ▼ 1.03% BBDC4 16.85 ▲ 0.36% ABEV3 14.89 ▼ 0.80% BBAS3 19.37 ▲ 0.47% B3SA3 14.26 ▼ 0.21% WEGE3 47.59 ▲ 0.49% PRIO3 59.14 ▼ 0.19% SUZB3 41.33 ▲ 2.35% RENT3 34.68 ▼ 0.09% AZZA3 15.89 ▼ 2.63% CSAN3 3.22 ▼ 1.83% RAIZ4 0.25 — 0.00% PCAR3 2.75 ▼ 0.36% GMAT3 3.65 ▼ 1.08% PSSA3 48.13 ▼ 0.54% CVCB3 1.33 ▼ 2.92% POSI3 3.36 ▲ 2.44% SLCE3 13.34 ▲ 0.30% NATU3 8.14 ▼ 0.73%
since 2009
Sunday, August 23, 2026

Brazil Life & Society

Brazilians Spend 3rd Highest Amount of Time on Apps: 3hs40m Daily

By · January 17, 2020 · 3 min read

Daily Brief

The morning intel from across Latin America. Free.

By subscribing you agree to our privacy policy. We never share your email.

RIO DE JANEIRO, BRAZIL – People in Brazil spent an average of 3 hours and 40 minutes using applications (also known as apps) in 2019. The rate is 35 percent higher than in 2017.

These figures come from the main report on the subject in the world, the consultancy firm App Annie. The 2020 edition was released on Wednesday, January 15th.

Brazil was surpassed only by China, where people mess with these programs for almost 4 hours, and Indonesia, where the daily time reached 4 hours and 40 minutes.
Brazil was surpassed only by China, where people mess with these programs for almost 4 hours, and Indonesia, where the daily time reached 4 hours and 40 minutes. (Photo internet reproduction)
One-stop reference
Company Intelligence
Every listed company in Latin America — financials, ownership and structure for 1,450+ companies across 26 exchanges, in one place.
Browse the directory →
RT
Ask Rio Times
This story and the bigger picture.
Open the full Ask Rio Times →

Brazil ranked third overall in terms of time spent on apps, slightly above the average, with 3 hours and 45 minutes.

Brazil was surpassed only by China, where people mess with these programs for almost 4 hours, and Indonesia, where the daily time reached 4 hours and 40 minutes. Next come South Korea (3h40) and India (3h30).

When comparing between 2019 and 2017, China had the largest increase (60 percent), followed by India, Canada and France (25 percent), Indonesia (20 percent) and Brazil, Germany, South Korea, Japan and the United Kingdom (15 percent).

When judging by age, the so-called generation Z (born between 1997 and 2012) spent 3 hours and 46 minutes per app per month and had 150 sessions per month on the main applications.

The annual download of applications grew by 45 percent over the last three years: from 140 billion in 2016 to almost 204 billion in 2019.

In Brazil, this increase was 40 percent, reaching about five billion last year. Among world countries, the largest increase in the period was from India: 190 percent.

Types

Finance apps were accessed one trillion times in 2019, a 100 percent growth compared to 2017. Brazil also ranked third for this type of program, behind only India and China.
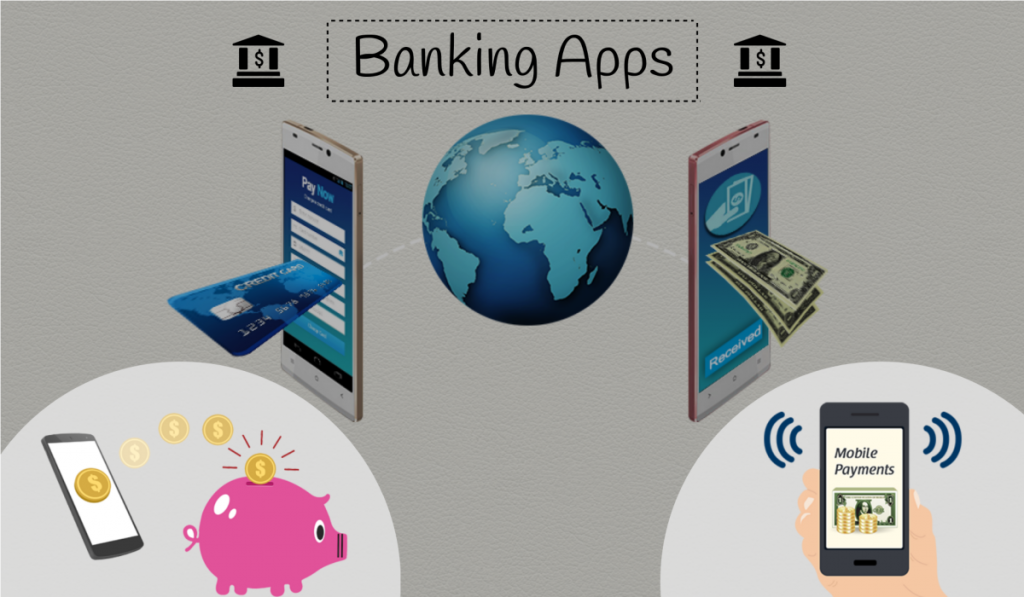
Finance apps were accessed one trillion times in 2019, a 100 percent growth compared to 2017. Brazil also ranked third for this type of program, behind only India and China.
Finance apps were accessed one trillion times in 2019, a 100 percent growth compared to 2017. Brazil also ranked third for this type of program, behind only India and China. (Photo Internet reproduction)

But while some countries already have most of their access in virtual portfolios (China and South Korea), in Brazil and others (such as Indonesia, France and Germany) digital transactions are mostly performed by bank apps. The most downloaded apps in this category were Nubank, FGTS, Picpay, Caixa and Mercadopago.

Brazil was also in third place for increase in time spent on shopping apps, behind India and Indonesia.

Between 2018 and 2019, Brazilians increased their use of this type of tool by 32 percent. The most downloaded apps for this purpose were Mercadolivre, Americanas, Magazine Luiza, AliExpress and Wish.

Brazil also maintained its position for use of food delivery apps. The number of sessions on this type of tool among users here was eight billion, behind the United States (10 billion) and Indonesia (20 billion).

In entertainment applications, Brazil ranked 7th between 2018 and 2019, with a growth rate of 32 percent.

The places where the use of these types of app was highest are India (78 percent), France (60 percent) and Japan (58 percent). The most downloaded apps of this type were Netflix, Youtube Go, Amazon PrimeVideo, Globoplay and Viki.

People spent an average of 3 hours and 40 minutes using applications (also known as apps) in 2019. The rate is 35 percent higher than in 2017.
People spent an average of 3 hours and 40 minutes using apps in 2019. The rate is 35 percent higher than in 2017. (Photo internet reproduction)

For social networks, the study did not disclose world ranking, but registered the strength of the Chinese app TikTok. The most downloaded list in Brazil includes Whatsapp, Status Saver, Snapchat, Telegram and Hago.

Investments

Application spending increased 110 percent from US$55 billion to US$120 billion over the same period. Games are responsible for 72 percent of the revenue. China has increased 190 percent over the last three years, reaching 40 percent of the world market.

In 2019, US$190 billion was spent on advertising on mobile devices. This year, the consultancy’s projection is for this number to reach US$240 billion.

Internet of Things

The document highlights the role of apps in the interconnected environment that has been called the ‘Internet of Things’. In the United States, the most downloaded apps for this type of ecosystem were Alexa and Google Home assistants, the Roku audiovisual services aggregator, the Xbox video game system, the Ring home security system and the application linked to a Fitbit connected clock.

This article was drafted with automated assistance and reviewed before publication. How we use AI · Report an error

Read More from The Rio Times

The Rio Times · Power Map
See who really holds power in Latin America
Click to open the Power Map

Rotate for Best Experience

This report is optimized for landscape viewing. Rotate your phone for the full experience.