IBGE Survey: Brazil Had 1.3 Million Service Sector Companies in 2017
RIO DE JANEIRO, BRAZIL – The Annual Services Survey (PAS 2017), released yesterday, August 28th, by the Brazilian Institute of Geography and Statistics (IBGE), shows that in 2017 there were 1.3 million companies providing non-financial services in Brazil, with a net operating revenue of R$1.5 trillion (US$375 billion) and a gross added value of R$906.5 billion. These companies employed 12.3 million people, to whom they paid R$336.7 billion in salaries, benefits, and other remuneration.

However, IBGE’s Analysis and Dissemination Manager, Synthia Santana, pointed out that although the Brazilian economy as a whole has recovered somewhat from the recession recorded in 2015 and 2016, service activity has not kept pace. Analyzing real data from the survey, between 2016 and 2017, there is a real drop in net operating revenue of 0.2 percent in the service sector. The number of companies also fell by 1.7 percent compared to 2016.
Between 2014, in the pre-crisis period, and 2017, the drop in service activity reached 6.9 percent. From 2015 to 2016, considered the period of the recession, some sectors managed to recover, but the services sector still reflected stagnation. The services sector is involved in providing services to families and businesses.
Transport
PAS 2017 analyses the services sector in the decade between 2008 and 2017. In nominal values at the time, determined in 2008, there were 831,210 companies in Brazil, which accounted for approximately 9 million employees, to whom they paid R$125.58 billion in salaries, benefits, and other remuneration. Companies in the sector showed a gross added value of R$369.13 billion and net operating revenue of R$665.13 billion. IBGE’s Santana pointed out that it is not possible to compare these numbers with the 2017 figures because IBGE only had an adequate index to do these calculations as of 2014.

The survey shows that, from a billing perspective, the transportation sector, transportation auxiliary services, and mail accounted for most of the sector’s net operating revenue. The share increased 0.6 percentage points, accounting for 29.5 percent of total revenue. This result was generated by the greater share of road freight transport (+1 percent) and storage and transportation auxiliary activities (+0.8 percent).
Passenger road transport fell by one percent. Synthia Santana drew attention to the fact that road freight transport benefited from the agricultural boom that occurred in the decade and the change in logistics in the country, particularly in the Center-West region.
According to the manager of IBGE, the transportation sector has been gaining participation. This sector ranked second in 2008, accounting for 28.9 percent, and rose to first place in 2017 (29.5 percent). The information and communication services sector, which led the ranking of participation in the sector’s net operating revenue in 2008, with 29.8 percent, dropped to third position (22.5 percent), while professional, administrative, and complimentary services rose from third to second place in ten years (from 24.2 to 26.2 percent).
Decentralization
“People are also becoming increasingly specialized in providing more complex services. And today, companies are specializing in this type of services and shifting more specific activities to other companies. Instead of concentrating this entire product range within the same company, they are hiring services from other companies that were previously provided by themselves,” said Synthia.

The breakdown of the seven sectors that make up the service activity into 34 other activities shows that food services recorded the greatest positive variation in the surveyed decade — +2.5 percentage points (pp), corresponding to 7.8 percent of service revenues in 2017, up from 5.3 percent in 2008. On the other hand, telecommunications stood out negatively, with a retraction of 7.5 pp, dropping from 18.1 to 10.6 percent on the same basis of comparison.
Considering the eight largest non-financial services companies in 2008, it appears that they accounted for fourteen percent of total net operating revenue; in 2017, this number fell to 9.5 percent. The only exception was the other service activities sector, which rose from 10.2 percent in 2008 to 16.6 percent in 2017. This sector consists of small companies that provide sewage collection and treatment services, or some financial services, for instance.
According to the survey, in other specific sectors, there are indications of concentration, when considering their breakdown into 34 activities. Although the transportation, transportation auxiliary services, and mail sector concentrates only fifteen percent of revenues in the eight most significant companies, most of its activities are highly concentrated: 99.9 percent in pipeline transportation, 93.9 percent in air transportation, 82 percent in mail and other delivery activities, and 79.6 percent in rail and subway transportation. The list of the most concentrated activities is complemented by telecommunications, with a concentration of revenue in the eight largest companies of 73.9 percent.
Employment and wages
The survey shows significant position changes concerning employment in the service sector. Professional, administrative, and complimentary services activities had a 40.4 percent share in 2008. In 2017, this number was reduced to 39.9 percent, employing 1.3 million people.
Synthia emphasized the increase in services provided primarily to families between 2008 (21 percent) and 2017 (22.6 percent). “The largest share continues to be food services, with 13.8 percent of the total number of people employed in the sector,” Synthia said. The food sector showed the largest increase in the absolute number of occupied personnel, which evolved from 1.2 million people to 1.7 million between 2008 and 2017.
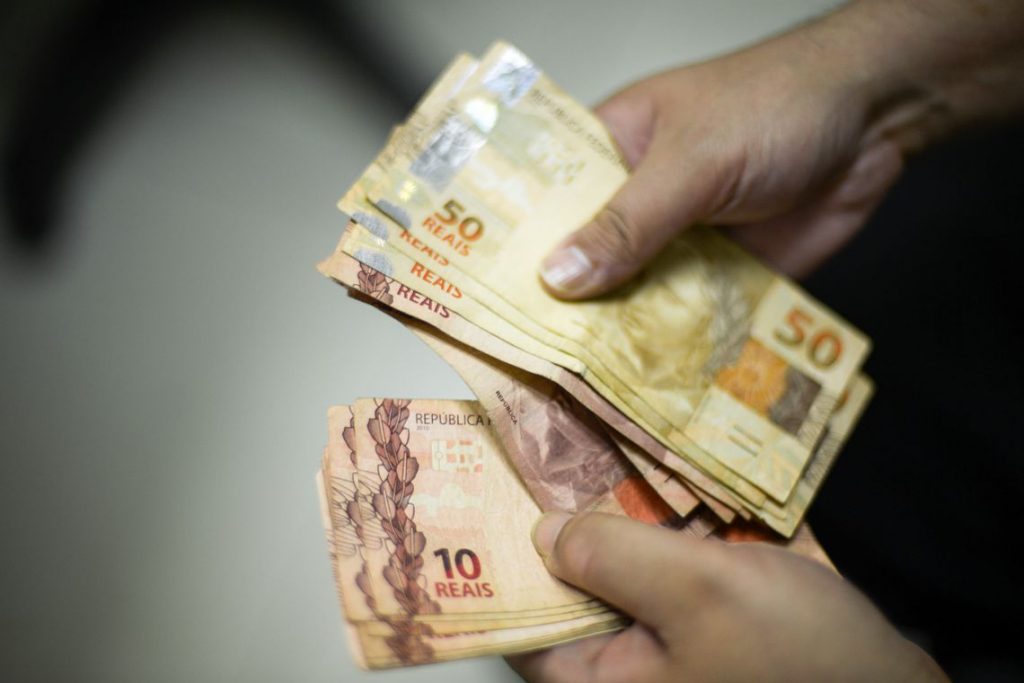
The average monthly salary of service companies fell from 2.6 minimum wages in 2008 to 2.2 wages in 2017. The IBGE manager said that although the salary measured in the survey is the minimum wage, which grew in the decade, the average remuneration of companies has still been decreasing. There is no clear explanation for this.
All Brazilian regions experienced a drop in the average monthly salary paid to employees in the sector, and the Southeast region was above the average, with 2.5 minimum wages, against 2.9 minimum wages in 2008. On the other hand, the Northeast region pays the lowest average wage since 2008, when it paid 1.9 minimum wages. In 2017, this figure fell to 1.7 minimum wages. Synthia said that this is also linked to the specific nature of the type of work that is developed within these regions. In the Southeast, services are more profitable.
The survey also shows that from 2014 to 2017, salaries paid for services decreased by 5.3 percent.
More: Brazil news in English, every day from The Rio Times.
This article was produced by The Rio Times’ automated newsroom system. How we use AI · Report an error · Editorial responsibility: Matthias Camenzind, Editor-in-Chief
Brazil runoff, Sunday, October 25: Brazil runoff start time and results schedule. Latest: Brazil runoff polls, Flávio 51%, Lula 49%.