IBOV 177,418.78 ▲ 1.00% IPSA 11,315.26 ▼ 1.14% IPC MEX 65,430.32 ▼ 0.08% MERVAL 3,033,848 ▲ 1.83% COLCAP 2,425.08 ▼ 1.33% BVL PERÚ 59,928.30 ▼ 0.80% USD/BRL5.19▲ 0.21% USD/MXN17.00▲ 0.03% USD/CLP933.85▲ 0.25% USD/COP3,212▲ 0.33% USD/PEN3.36▼ 0.13% USD/ARS1,509▼ 0.28% USD/UYU40.29▲ 0.05% USD/PYG5,892▼ 0.13% USD/BOB11.84▲ 0.51% USD/DOP58.64▲ 0.05% USD/CRC446.47▼ 0.04% USD/GTQ7.62▼ 0.02% USD/HNL26.84— 0.00% USD/NIO36.62▲ 0.14% USD/VES796.33▲ 0.29% USD/PAB1.00— 0.00% USD/BZD2.00— 0.00% USD/JMD 157.28 — 0.00% USD/TTD6.69▼ 0.37% EUR/BRL6.03▲ 0.29% BRENT 88.88 ▼ 0.03% WTI 83.11 ▼ 0.11% IRON ORE 161.91 — — COPPER 6.61 ▲ 0.03% GOLD 4,461 ▲ 1.78% SILVER 65.59 ▲ 1.26% SOY 1,184 ▲ 3.20% CORN 480.50 ▲ 10.02% WHEAT 655.00 ▲ 3.93% COFFEE 317.25 ▼ 5.51% SUGAR 16.43 ▼ 1.79% ORANGE JUICE 138.55 ▼ 0.47% COTTON 85.03 ▲ 2.33% COCOA 5,719 ▲ 3.18% BEEF 223.60 ▼ 3.93% CATTLE 339.10 ▼ 3.16% LITHIUM 75.20 ▲ 1.47% PETR4 41.64 ▼ 0.05% VALE3 72.97 ▲ 0.83% ITUB4 38.60 ▼ 1.03% BBDC4 16.85 ▲ 0.36% ABEV3 14.89 ▼ 0.80% BBAS3 19.37 ▲ 0.47% B3SA3 14.26 ▼ 0.21% WEGE3 47.59 ▲ 0.49% PRIO3 59.14 ▼ 0.19% SUZB3 41.33 ▲ 2.35% RENT3 34.68 ▼ 0.09% AZZA3 15.89 ▼ 2.63% CSAN3 3.22 ▼ 1.83% RAIZ4 0.25 — 0.00% PCAR3 2.75 ▼ 0.36% GMAT3 3.65 ▼ 1.08% PSSA3 48.13 ▼ 0.54% CVCB3 1.33 ▼ 2.92% POSI3 3.36 ▲ 2.44% SLCE3 13.34 ▲ 0.30% NATU3 8.14 ▼ 0.73% IBOV 177,418.78 ▲ 1.00% IPSA 11,315.26 ▼ 1.14% IPC MEX 65,430.32 ▼ 0.08% MERVAL 3,033,848 ▲ 1.83% COLCAP 2,425.08 ▼ 1.33% BVL PERÚ 59,928.30 ▼ 0.80% USD/BRL 5.16 ▲ 0.01% USD/MXN 17.06 ▼ 0.24% USD/CLP 913.98 ▲ 0.04% USD/COP 3,140 ▲ 0.03% USD/PEN 3.36 ▼ 0.66% USD/ARS 1,493 ▲ 0.10% USD/UYU 40.27 ▲ 1.24% USD/PYG 5,939 ▲ 1.68% USD/BOB 11.64 ▼ 0.76% USD/DOP 58.34 ▲ 1.25% USD/CRC 445.92 ▲ 0.89% USD/GTQ 7.62 ▲ 2.21% USD/HNL 26.79 ▲ 1.57% USD/NIO 36.62 ▲ 0.69% USD/VES 762.44 ▼ 0.13% USD/PAB 1.00 — 0.00% USD/BZD 2.00 — 0.00% USD/JMD 157.28 — 0.00% USD/TTD 6.70 ▲ 0.61% EUR/BRL 5.95 ▲ 1.01% BRENT 88.88 ▼ 0.03% WTI 83.11 ▼ 0.11% IRON ORE 161.91 — — COPPER 6.61 ▲ 0.03% GOLD 4,461 ▲ 1.78% SILVER 65.59 ▲ 1.26% SOY 1,184 ▲ 3.20% CORN 480.50 ▲ 10.02% WHEAT 655.00 ▲ 3.93% COFFEE 317.25 ▼ 5.51% SUGAR 16.43 ▼ 1.79% ORANGE JUICE 138.55 ▼ 0.47% COTTON 85.03 ▲ 2.33% COCOA 5,719 ▲ 3.18% BEEF 223.60 ▼ 3.93% CATTLE 339.10 ▼ 3.16% LITHIUM 75.20 ▲ 1.47% PETR4 41.64 ▼ 0.05% VALE3 72.97 ▲ 0.83% ITUB4 38.60 ▼ 1.03% BBDC4 16.85 ▲ 0.36% ABEV3 14.89 ▼ 0.80% BBAS3 19.37 ▲ 0.47% B3SA3 14.26 ▼ 0.21% WEGE3 47.59 ▲ 0.49% PRIO3 59.14 ▼ 0.19% SUZB3 41.33 ▲ 2.35% RENT3 34.68 ▼ 0.09% AZZA3 15.89 ▼ 2.63% CSAN3 3.22 ▼ 1.83% RAIZ4 0.25 — 0.00% PCAR3 2.75 ▼ 0.36% GMAT3 3.65 ▼ 1.08% PSSA3 48.13 ▼ 0.54% CVCB3 1.33 ▼ 2.92% POSI3 3.36 ▲ 2.44% SLCE3 13.34 ▲ 0.30% NATU3 8.14 ▼ 0.73%
since 2009
Tuesday, September 1, 2026

Brazilian Industry Stagnant in First Half of 2019

By · August 2, 2019 · 2 min read

Daily Brief

The morning intel from across Latin America. Free.

By subscribing you agree to our privacy policy. We never share your email.

RIO DE JANEIRO, BRAZIL – The first semester of the year saw stagnation in Brazilian industry, according to a survey by the National Confederation of Industry (CNI), released yesterday, August 1st. The research corroborates the poor performance of industrial activity in Brazil.
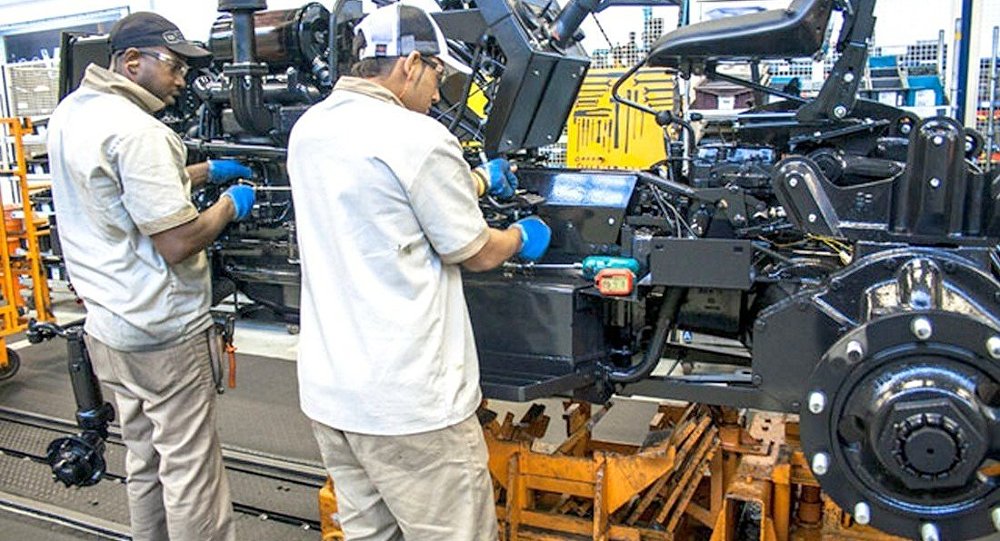
The number of hours worked in production fell slightly by 0.1 percent in June compared to May in the non-seasonal series.
The number of hours worked in production fell slightly by 0.1 percent in June compared to May in the non-seasonal series. (Photo internet reproduction)
One-stop reference
Company Intelligence
Every listed company in Latin America — financials, ownership and structure for 1,450+ companies across 26 exchanges, in one place.
Browse the directory →
RT
Ask Rio Times
Latin American markets, currencies and companies.
Open the full Ask Rio Times →

“The sector’s revenues fell one percent from those of the same period of 2018, hours worked in production remained stable, employment fell slightly by 0.1 percent, the actual salary bill declined by 1.9 percent, and the average actual worker income decreased 1.8 percent compared to the first half of 2018. The average capacity use in the first semester is 0.1 percentage point lower than the same period in 2018,” said CNI.

The June data shows that of all industrial indicators, only turnover recorded a favorable rate; the others retreated. According to CNI, after the 2.2 percent drop recorded in May, the industry’s revenues increased 0.3 percent in June compared to May in the non-seasonal series. The use of installed capacity fell 0.7 percent compared to May.

The actual salaries paid decreased 0.7 percent, similar to the drop in the average worker income indicator, which also dropped 0.7 percent in June in relation to May in the non-seasonal series. The June drop in the actual salary bill reversed the growth recorded in the previous two months and is 0.8 percent lower than in June of last year.

The number of hours worked in production fell slightly by 0.1 percent in June compared to May in the non-seasonal series. The survey also shows that employment remained stable in June. The data show that, in the last twelve months, the employment indicator was stable for seven months, dropping four months and growing only one.

“Industry ended the semester without progress in terms of activity and employment. It is clear that, in addition to the structural, long-term measures required for a new cycle of growth, short-term measures to boost the economy are also urgent and critical. The 0.5 percentage point reduction in the Selic rate was a crucial first step in this direction. There is room for further reductions. Additionally, measures to facilitate and reduce the cost of financing would also be very significant,” said CNI economist Marcelo Azevedo.

Read More from The Rio Times

The Rio Times · Power Map
See who really holds power in Latin America
Click to open the Power Map

Rotate for Best Experience

This report is optimized for landscape viewing. Rotate your phone for the full experience.