Brazil’s Per Capita GDP Has Fallen in Seven Years, as Brazilians Become 11 Percent Poorer
RIO DE JANEIRO, BRAZIL – In a period of seven years, Brazilians are heading towards becoming approximately eleven percent poorer. The recession observed between late 2014 and 2016, the slow economic rebound in the following years, and the recent crisis triggered by the coronavirus led Brazil to lose part of its wealth.
Between 2013 – the last year of more robust economic growth – and the end of 2020, the Gross Domestic Product (GDP) per capita will drop from R$8,519 (US$1,700) to R$7,559 (US$1,500) and will have shrunk 11.3 percent in the period, according to calculations by LCA consultancy.
“The reality is much grimmer than this data alone. In this period, the average growth of the world was four percent per year,” says Cosmo Donato, an economist at LCA. “One must also consider how much the country has stopped growing, mainly in comparison with other emerging economies. The hole is deeper than it seems.”

The GDP per capita is the sum of everything that the country produces, divided by the total population, and works as an important tool to assess the wealth of a nation. It rises when economic activity progresses at a faster pace than population growth. The LCA survey considers estimates for quarterly GDP and uses the four-quarter rolling average, which enables a fairer comparison.
In recent years, the Brazilian economy has faced a combination of many challenges. Between late 2014 and 2016, the country experienced a sharp recession caused by several macroeconomic imbalances and political turmoil during the Dilma Rousseff administration. In the next three years, the rebound was timid, unable to offset the accumulated damage. Now, the crisis triggered by the coronavirus has become yet another component of that troubled period.
In 2020, analysts consulted by the Central Bank’s Focus report estimate a 5.77 percent drop in GDP.
“The 2015 and 2016 crisis was quite deep. There was a GDP contraction of seven percent and we only recovered about half of that,” says Kairós Capital’s partner and economist André Loes. “The end of last year promised an acceleration for this year, maybe the country would have grown between two and 2.5 percent, but then came the pandemic,” he says.
Mobility interrupted
Brazil’s impoverishment is also evidenced when one analyzes the country’s socioeconomic behavior. After witnessing the boom of the so-called (middle) class C in the end of the last decade and the beginning of this one, the country has recorded a slight worsening of social mobility in recent years, according to a survey conducted by Kantar.
In 2014, 27.5 percent of Brazilian homes were in class A and B. By the end of this year, this group is expected to retreat to 26.3 percent. During this period, class E will increase from 24.7 to 25.2 percent of homes.
“In the past, many people from class D and E migrated to class C. Since 2016, this trend is no longer present,” says David Fiss, Kantar’s director of customer service and new business. “And what we are starting to see this year, as an effect of the crisis, is a loss of numbers in classes A/B and C and a growth of classes D/E.”
Unemployment on the rise
Unemployment has been one of the most perverse consequences of the economy’s poor performance and helps explain the country’s impoverishment.
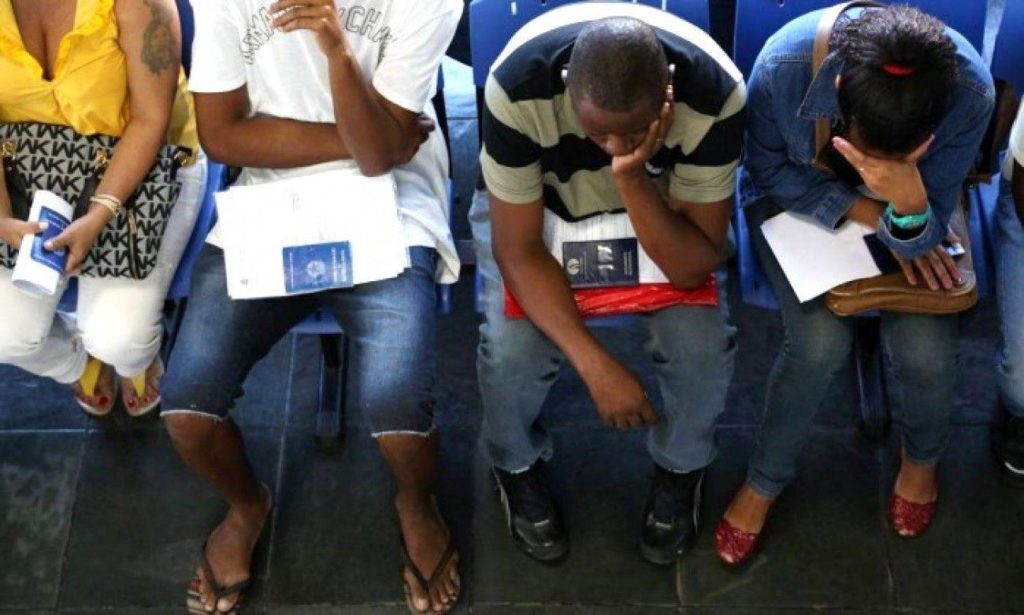
Last year, the labor market actually improved, but it was heavily based on informality. The crisis triggered by the coronavirus, however, has aborted any expectation of a rebound. In May, the unemployment rate stood at 12.9 percent, and the numbers are expected to worsen over the coming months.
Dismissed six months ago, 29-year-old Wesley dos Santos Lima is facing unemployment for the second time within a short period – between 2016 and 2017 he was also unemployed for seven months. “We’re the kind of people who have to have work or an odd job to have something better in our home,” he says.
Married, with a five-year-old son, Wesley also saw his wife lose her job because of the pandemic. Without the income from work, the family had to cut redundant items to adjust their budget. “We don’t have overdue bills, we prioritize these payments,” he says. “But we’ve made some cuts in what we buy and also in leisure.”
Wesley lived four months with unemployment insurance benefits and now he is seeking a job placement at a time of severe economic hardship. “A few years ago I saw more work potential, mainly in the area of security. But now, with the pandemic, it’s more challenging.”
Short- and long-term agendas
An enrichment of Brazil requires both a short- and long-term agenda.
In the short term, analysts point out that the country must show, first and foremost, a commitment to the fiscal aspect in order to prevent investors’ distrust.
With the pandemic, the government was forced to increase spending to mitigate the impact of the crisis, which will raise Brazil’s indebtedness. According to analysts, adjustment measures will have to be resumed after the pandemic is overcome – the country entered this crisis with a rather high level of indebtedness for a developing country.
“The country has to quickly switch to austerity mode,” Loes says. “Brazil had started to eradicate the debt growth, but it will rise to some 97 percent of GDP this year,” he says. In 2019, Brazil’s gross debt accounted for 75.8 percent of GDP.
In the medium and long term, Brazil’s agenda includes measures that involve improving productivity to allow for potential economic growth.
Consequently, measures to simplify the business environment are required in order to improve the investment framework, for instance, and invest in education in order to have a more skilled workforce.
“Measures that facilitate investment will lead to better trained, better-educated workers producing more, and our per capita GDP will grow,” Loes says.
Source: G1
More: Brazil news in English, every day from The Rio Times.
This article was produced by The Rio Times’ automated newsroom system. How we use AI · Report an error
Read More from The Rio Times