IBOV 177,999.00 ▲ 0.47% IPSA 11,016.85 ▼ 0.13% IPC MEX 66,935.53 ▼ 0.58% MERVAL 3,291,323 ▼ 0.41% COLCAP 2,392.10 ▲ 2.12% BVL PERÚ 57,890.85 — — USD/BRL5.07▼ 0.09% USD/MXN17.33▼ 0.10% USD/CLP 930.47 — 0.00% USD/COP3,151▼ 1.55% USD/PEN3.39▼ 0.05% USD/ARS 1,485 — 0.00% USD/UYU40.20▲ 1.31% USD/PYG5,931▲ 0.69% USD/BOB12.10▲ 8.06% USD/DOP57.99▲ 0.14% USD/CRC448.40▲ 1.30% USD/GTQ7.62▲ 2.31% USD/HNL26.76▲ 0.39% USD/NIO 36.62 — 0.00% USD/VES744.76▼ 0.13% USD/PAB1.00— 0.00% USD/BZD2.00— 0.00% USD/JMD157.19▲ 0.48% USD/TTD6.72▲ 0.83% EUR/BRL5.85▼ 0.37% BRENT 90.12 ▲ 1.22% WTI 84.67 ▲ 1.29% IRON ORE 161.91 — — COPPER 6.47 ▲ 0.33% GOLD 4,107 ▲ 0.17% SILVER 57.79 ▼ 1.75% SOY 1,188 ▲ 0.87% CORN 464.00 ▲ 4.09% WHEAT 639.25 ▼ 3.65% COFFEE 313.55 ▼ 2.94% SUGAR 14.65 ▲ 1.52% ORANGE JUICE 153.35 ▲ 5.03% COTTON 81.20 ▲ 2.25% COCOA 5,537 ▲ 8.31% BEEF 227.25 ▼ 1.72% CATTLE 343.78 ▼ 0.78% LITHIUM 69.22 ▼ 0.85% PETR4 43.42 ▲ 1.35% VALE3 76.28 ▲ 0.25% ITUB4 42.89 ▲ 0.35% BBDC4 18.43 ▲ 0.22% ABEV3 15.99 ▲ 0.19% BBAS3 21.35 ▲ 0.76% B3SA3 15.73 ▲ 0.64% WEGE3 47.20 ▲ 0.81% PRIO3 60.85 ▲ 1.48% SUZB3 43.32 ▲ 1.38% RENT3 37.61 ▼ 1.62% AZZA3 16.42 ▲ 3.53% CSAN3 4.07 ▲ 2.01% RAIZ4 0.26 — 0.00% PCAR3 2.59 ▼ 5.47% GMAT3 4.03 ▲ 1.26% PSSA3 54.70 ▲ 0.64% CVCB3 1.31 ▲ 0.77% POSI3 3.55 ▲ 0.85% SLCE3 13.38 ▲ 0.91% NATU3 8.38 ▲ 0.60% BRKM5 5.97 ▲ 0.67% RANI3 8.11 ▲ 1.00% CSNA3 4.84 ▼ 2.22% CMIN3 5.71 ▼ 0.17% USIM5 7.36 ▼ 2.52% GGBR4 24.98 — 0.00% ENEV3 26.31 ▲ 0.61% CPFE3 46.14 ▲ 0.11% CMIG4 11.34 ▲ 0.98% EQTL3 38.66 — 0.00% LREN3 13.60 ▲ 0.59% VIVT3 32.63 — 0.00% RAIL3 14.44 ▲ 1.12% KLABIN 18.25 ▲ 1.11% RAIA DROGASIL 18.48 ▲ 1.26% RDOR3 34.64 ▲ 0.64% HAPV3 11.28 ▲ 2.45% FLRY3 17.14 ▲ 1.00% SMTO3 14.52 ▲ 0.83% UGPA3 33.05 ▲ 0.39% VBBR3 36.05 ▲ 1.18% BBSE3 41.26 ▲ 0.98% BPAC11 56.80 ▲ 0.32% CURY3 30.09 ▼ 1.02% AERI3 2.15 ▲ 0.94% VIVARA 22.18 ▲ 0.09% COMPASS 24.84 — 0.00% VAMOS 3.34 ▼ 2.34% SANB11 28.62 ▲ 13.35% ASAI3 8.50 ▲ 1.07% SBSP3 27.70 ▲ 1.06% WALMEX 50.36 ▲ 0.34% GMEXICO 208.29 ▼ 2.20% FEMSA 221.95 ▲ 1.19% CEMEX 20.54 ▼ 0.73% GFNORTE 199.64 ▼ 0.32% BIMBO 62.08 ▲ 2.26% TELEVISA 9.79 ▼ 0.91% AMX 22.00 — 0.00% GAP 376.64 ▼ 1.08% ASUR 275.62 ▼ 0.34% OMA 231.05 ▼ 0.96% KOF 187.94 ▼ 0.14% GRUMA 258.23 ▼ 4.00% KIMBER 40.19 ▼ 0.17% SQM-B 62,700 ▼ 0.93% COPEC 6,350 ▲ 0.79% BSANTANDER 80.99 ▲ 0.36% FALABELLA 6,216 ▼ 0.06% ENELAM 87.99 ▲ 0.39% CENCOSUD 1,955 ▲ 0.51% CMPC 1,055 ▲ 2.43% BANCO CHILE 193.71 — 0.00% LATAM AIR 24.74 ▼ 0.64% YPF 82,900 ▲ 1.94% GGAL 7,890 ▼ 1.56% PAMPA 5,555 ▲ 0.36% TXAR 655.50 ▲ 1.16% ALUAR 977.50 ▼ 0.20% TGS 10,050 ▲ 2.45% CEPU 2,396 ▼ 0.33% MIRGOR 16,350 ▼ 1.95% COME 44.03 ▼ 1.94% LOMA NEGRA 3,620 ▼ 1.76% BYMA 296.00 ▼ 0.34% TELECOM ARG 4,408 ▲ 2.14% ECOPETROL 16.77 ▼ 1.58% BANCOLOMBIA 92.52 ▼ 1.46% GRUPO AVAL 5.28 ▲ 2.75% CREDICORP 400.58 ▼ 0.42% SOUTHERN COPPER 182.71 ▼ 1.24% BUENAVENTURA 30.28 ▼ 4.96% MERCADOLIBRE 1,878 ▼ 0.41% NUBANK 14.33 ▼ 1.10% XP 17.06 ▼ 0.81% PAGSEGURO 9.64 ▼ 2.03% STONE 11.38 ▼ 0.48% GLOBANT 36.60 ▲ 0.58% TECNOGLASS 43.44 ▼ 0.34% GAP AIRPORT 217.35 ▼ 1.02% ASUR 275.62 ▼ 0.34% OMA AIRPORT 106.90 ▼ 1.10% AMX ADR 25.37 ▲ 0.18% FEMSA ADR 127.99 ▲ 0.97% CEMEX ADR 11.82 ▼ 0.92% PETROBRAS ADR 19.40 ▲ 1.46% VALE ADR 15.06 ▲ 0.47% ITAU ADR 8.46 ▲ 0.24% SANTANDER BR 5.67 ▲ 12.28% AMBEV ADR 3.11 ▼ 0.32% CSN 0.99 ▼ 2.42% GERDAU 4.96 — 0.00% LATAM ADR 52.75 ▼ 2.21% BTC 62,998 ▲ 0.37% ETH 1,851 ▲ 0.43% SOL 72.96 ▲ 1.52% XRP 1.08 ▲ 1.83% BNB 582.05 ▲ 1.23% ADA 0.19 ▲ 7.68% DOGE 0.07 ▲ 1.36% AVAX 6.56 ▲ 6.08% LINK 8.26 ▲ 2.53% DOT 0.80 ▲ 2.11% LTC 44.57 ▲ 0.87% BCH 211.94 ▲ 1.93% TRX 0.33 ▼ 0.06% XLM 0.17 ▲ 1.85% HBAR 0.07 ▲ 1.42% NEAR 1.69 ▲ 1.16% ATOM 1.25 ▲ 2.13% AAVE 90.80 ▲ 0.31% SELIC 14.25% EMBRAER 86.89 ▲ 0.87% EMBRAER ADR 68.33 ▲ 0.32% JBS 14.02 ▼ 1.89% JBS BDR 70.70 ▼ 2.01% MBRF3 17.54 ▼ 2.34% MBRFY 3.39 ▼ 2.31% INTER 5.60 ▼ 0.71% IBOV 177,999.00 ▲ 0.47% IPSA 11,016.85 ▼ 0.13% IPC MEX 66,935.53 ▼ 0.58% MERVAL 3,291,323 ▼ 0.41% COLCAP 2,392.10 ▲ 2.12% BVL PERÚ 57,890.85 — — USD/BRL 5.07 ▼ 0.09% USD/MXN 17.33 ▼ 0.01% USD/CLP 930.47 — 0.00% USD/COP 3,151 ▲ 0.93% USD/PEN 3.39 ▼ 0.01% USD/ARS 1,485 — 0.00% USD/UYU 40.20 ▲ 1.25% USD/PYG 5,931 ▲ 1.14% USD/BOB 12.10 ▲ 4.29% USD/DOP 57.99 ▲ 0.24% USD/CRC 448.40 ▲ 1.33% USD/GTQ 7.62 ▲ 2.31% USD/HNL 26.76 ▲ 1.53% USD/NIO 36.62 — 0.00% USD/VES 744.76 ▼ 0.41% USD/PAB 1.00 — 0.00% USD/BZD 2.00 — 0.00% USD/JMD 157.19 ▲ 0.37% USD/TTD 6.72 ▲ 0.86% EUR/BRL 5.85 ▼ 0.37% BRENT 90.12 ▲ 1.22% WTI 84.67 ▲ 1.29% IRON ORE 161.91 — — COPPER 6.47 ▲ 0.33% GOLD 4,107 ▲ 0.17% SILVER 57.79 ▼ 1.75% SOY 1,188 ▲ 0.87% CORN 464.00 ▲ 4.09% WHEAT 639.25 ▼ 3.65% COFFEE 313.55 ▼ 2.94% SUGAR 14.65 ▲ 1.52% ORANGE JUICE 153.35 ▲ 5.03% COTTON 81.20 ▲ 2.25% COCOA 5,537 ▲ 8.31% BEEF 227.25 ▼ 1.72% CATTLE 343.78 ▼ 0.78% LITHIUM 69.22 ▼ 0.85% PETR4 43.42 ▲ 1.35% VALE3 76.28 ▲ 0.25% ITUB4 42.89 ▲ 0.35% BBDC4 18.43 ▲ 0.22% ABEV3 15.99 ▲ 0.19% BBAS3 21.35 ▲ 0.76% B3SA3 15.73 ▲ 0.64% WEGE3 47.20 ▲ 0.81% PRIO3 60.85 ▲ 1.48% SUZB3 43.32 ▲ 1.38% RENT3 37.61 ▼ 1.62% AZZA3 16.42 ▲ 3.53% CSAN3 4.07 ▲ 2.01% RAIZ4 0.26 — 0.00% PCAR3 2.59 ▼ 5.47% GMAT3 4.03 ▲ 1.26% PSSA3 54.70 ▲ 0.64% CVCB3 1.31 ▲ 0.77% POSI3 3.55 ▲ 0.85% SLCE3 13.38 ▲ 0.91% NATU3 8.38 ▲ 0.60% BRKM5 5.97 ▲ 0.67% RANI3 8.11 ▲ 1.00% CSNA3 4.84 ▼ 2.22% CMIN3 5.71 ▼ 0.17% USIM5 7.36 ▼ 2.52% GGBR4 24.98 — 0.00% ENEV3 26.31 ▲ 0.61% CPFE3 46.14 ▲ 0.11% CMIG4 11.34 ▲ 0.98% EQTL3 38.66 — 0.00% LREN3 13.60 ▲ 0.59% VIVT3 32.63 — 0.00% RAIL3 14.44 ▲ 1.12% KLABIN 18.25 ▲ 1.11% RAIA DROGASIL 18.48 ▲ 1.26% RDOR3 34.64 ▲ 0.64% HAPV3 11.28 ▲ 2.45% FLRY3 17.14 ▲ 1.00% SMTO3 14.52 ▲ 0.83% UGPA3 33.05 ▲ 0.39% VBBR3 36.05 ▲ 1.18% BBSE3 41.26 ▲ 0.98% BPAC11 56.80 ▲ 0.32% CURY3 30.09 ▼ 1.02% AERI3 2.15 ▲ 0.94% VIVARA 22.18 ▲ 0.09% COMPASS 24.84 — 0.00% VAMOS 3.34 ▼ 2.34% SANB11 28.62 ▲ 13.35% ASAI3 8.50 ▲ 1.07% SBSP3 27.70 ▲ 1.06% WALMEX 50.36 ▲ 0.34% GMEXICO 208.29 ▼ 2.20% FEMSA 221.95 ▲ 1.19% CEMEX 20.54 ▼ 0.73% GFNORTE 199.64 ▼ 0.32% BIMBO 62.08 ▲ 2.26% TELEVISA 9.79 ▼ 0.91% AMX 22.00 — 0.00% GAP 376.64 ▼ 1.08% ASUR 275.62 ▼ 0.34% OMA 231.05 ▼ 0.96% KOF 187.94 ▼ 0.14% GRUMA 258.23 ▼ 4.00% KIMBER 40.19 ▼ 0.17% SQM-B 62,700 ▼ 0.93% COPEC 6,350 ▲ 0.79% BSANTANDER 80.99 ▲ 0.36% FALABELLA 6,216 ▼ 0.06% ENELAM 87.99 ▲ 0.39% CENCOSUD 1,955 ▲ 0.51% CMPC 1,055 ▲ 2.43% BANCO CHILE 193.71 — 0.00% LATAM AIR 24.74 ▼ 0.64% YPF 82,900 ▲ 1.94% GGAL 7,890 ▼ 1.56% PAMPA 5,555 ▲ 0.36% TXAR 655.50 ▲ 1.16% ALUAR 977.50 ▼ 0.20% TGS 10,050 ▲ 2.45% CEPU 2,396 ▼ 0.33% MIRGOR 16,350 ▼ 1.95% COME 44.03 ▼ 1.94% LOMA NEGRA 3,620 ▼ 1.76% BYMA 296.00 ▼ 0.34% TELECOM ARG 4,408 ▲ 2.14% ECOPETROL 16.77 ▼ 1.58% BANCOLOMBIA 92.52 ▼ 1.46% GRUPO AVAL 5.28 ▲ 2.75% CREDICORP 400.58 ▼ 0.42% SOUTHERN COPPER 182.71 ▼ 1.24% BUENAVENTURA 30.28 ▼ 4.96% MERCADOLIBRE 1,878 ▼ 0.41% NUBANK 14.33 ▼ 1.10% XP 17.06 ▼ 0.81% PAGSEGURO 9.64 ▼ 2.03% STONE 11.38 ▼ 0.48% GLOBANT 36.60 ▲ 0.58% TECNOGLASS 43.44 ▼ 0.34% GAP AIRPORT 217.35 ▼ 1.02% ASUR 275.62 ▼ 0.34% OMA AIRPORT 106.90 ▼ 1.10% AMX ADR 25.37 ▲ 0.18% FEMSA ADR 127.99 ▲ 0.97% CEMEX ADR 11.82 ▼ 0.92% PETROBRAS ADR 19.40 ▲ 1.46% VALE ADR 15.06 ▲ 0.47% ITAU ADR 8.46 ▲ 0.24% SANTANDER BR 5.67 ▲ 12.28% AMBEV ADR 3.11 ▼ 0.32% CSN 0.99 ▼ 2.42% GERDAU 4.96 — 0.00% LATAM ADR 52.75 ▼ 2.21% BTC 62,998 ▲ 0.37% ETH 1,851 ▲ 0.43% SOL 72.96 ▲ 1.52% XRP 1.08 ▲ 1.83% BNB 582.05 ▲ 1.23% ADA 0.19 ▲ 7.68% DOGE 0.07 ▲ 1.36% AVAX 6.56 ▲ 6.08% LINK 8.26 ▲ 2.53% DOT 0.80 ▲ 2.11% LTC 44.57 ▲ 0.87% BCH 211.94 ▲ 1.93% TRX 0.33 ▼ 0.06% XLM 0.17 ▲ 1.85% HBAR 0.07 ▲ 1.42% NEAR 1.69 ▲ 1.16% ATOM 1.25 ▲ 2.13% AAVE 90.80 ▲ 0.31% SELIC 14.25% EMBRAER 86.89 ▲ 0.87% EMBRAER ADR 68.33 ▲ 0.32% JBS 14.02 ▼ 1.89% JBS BDR 70.70 ▼ 2.01% MBRF3 17.54 ▼ 2.34% MBRFY 3.39 ▼ 2.31% INTER 5.60 ▼ 0.71%
since 2009
Sunday, August 2, 2026

Life & Society Society

Post-Pandemic: Debt of World’s Poorest Will Explode in Five Years

By · August 11, 2020 · 3 min read

Daily Brief

The morning intel from across Latin America. Free.

By subscribing you agree to our privacy policy. We never share your email.

RIO DE JANEIRO, BRAZIL – While the poor run into debt, the wealthy save more.

The trend that governments and Central Banks have been pursuing since the start of the coronavirus crisis may have been undermined for the time being, but the chances are high for a worsening scenario after the end of emergency aid to companies and the vulnerable.

The alert is provided by an Oxford Economics report, which sees the risk of a sharp deterioration in the global inequality scenario over the next five years due to the pandemic.

Income inequality after pandemics: Gini index advance (%) (higher indicates more inequality).
Income inequality after pandemics: Gini index advance (%) (higher indicates more inequality). (Photo: Oxford Economics)
One-stop reference
Company Intelligence
Every listed company in Latin America — financials, ownership and structure for 1,450+ companies across 26 exchanges, in one place.
Browse the directory →
RT
Ask Rio Times
17 years of Latin America reporting, on demand.
Open the full Ask Rio Times →

This trend has been fuelled since the 1980s by the strong migration of income to the wealthier section of the population, on the one hand, and by the growing indebtedness of the poorer families, on the other.

“The poorest families spend more of their income on essential goods such as housing and basic foodstuffs. When their income drops, they are still forced to spend on what is necessary and are therefore often forced into debt,” it says.

The wealthy, on the other hand, typically use up almost the maximum capacity of their consumption desires, so any additional income is saved for future support.

In addition, “evidence from past pandemics points to an increase in income inequality since the burden of economic adjustment falls disproportionately on low-skilled workers,” the paper says.

In pandemic contexts, low-skilled work is also more often undermined by isolation policies that impair confidence in the use of in-person services.

“A unique feature of this pandemic is that the ability to work from home is proving to be a key factor in determining job losses,” says Oxford Economics.

In other words, the most threatened jobs are those that cannot easily be performed at home (e.g. restaurants) and are also typically underpaid.

The losses among the poorest were also the greatest during the 2008 global financial crisis.

The effect is perpetual

There are three ways to describe inequality in a society, explains the consultancy:

  • Income, which has far-reaching short-term implications;
  • Wealth, which results in a deepening division over time: income is generated and often consumed during the lifetime of a family; wealth, however, can be inherited and passed on from generation to generation.
  • Consumption, which shows how consumption of goods and services is spread throughout the economy: The drop in consumer spending in recent months has been much greater for higher-income groups, as more spending can be deferred.

This latter way of measuring inequality is relevant because spending is often smoothed out over an individual’s lifetime by means of loans, savings, and emergency aid and therefore may differ from income at times.

High-income households are still spending 11 percent below pre-coronavirus trends, compared with a high of two percent among the poorest.

Historical

Income inequality has grown substantially since the 1980s in advanced economies, particularly in the United Kingdom and the United States, after technological changes in the labor market and the fragility of labor unions, says the consultancy:

Between the early 1980s and 2017, the share of income held by the top one percent doubled from 11 percent in the US and six percent in the UK to 21 and 13 percent, respectively.

Over the past three decades, the distribution of wealth in France, the United Kingdom and the US has also become even more slanted towards the top of the social pyramid. On average, the poorest 50 percent held only six percent of total wealth in the mid-1980s; by 2014, this had halved to only three percent.

During that period, the wealth of the richest ten percent grew rapidly from 53 to 71 percent.

The graph below shows a sharp increase in revenues (red line) to the wealthiest one percent since the 1980s, which contributed to debt (blue line) reaching levels unseen since World War II:
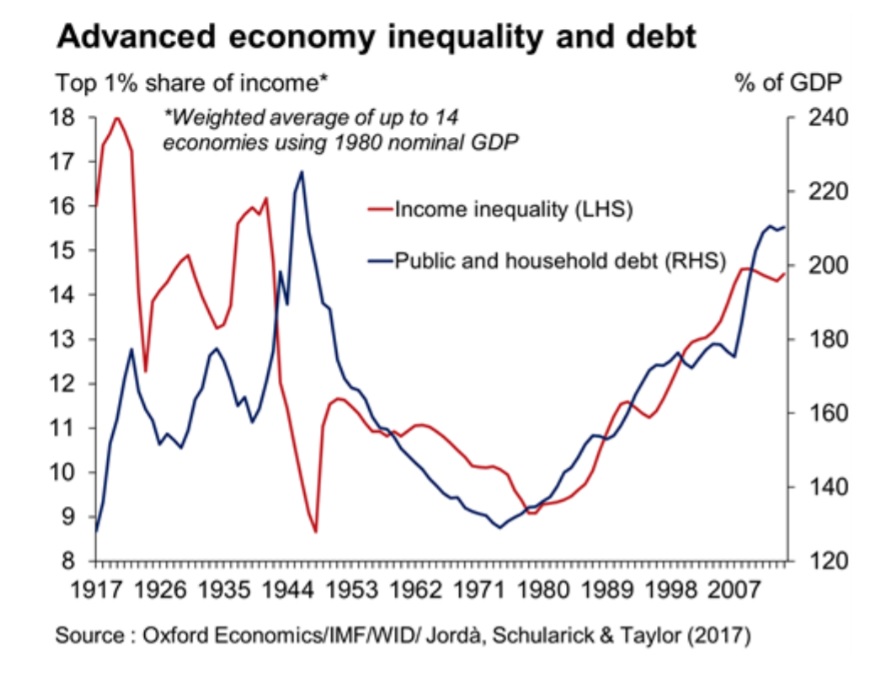
The graph shows a sharp increase in revenues (red line) to the wealthiest one percent since the 1980s, which contributed to debt (blue line) reaching levels unseen since World War II.
The graph shows a sharp increase in revenues (red line) to the wealthiest one percent since the 1980s, which contributed to debt (blue line) reaching levels unseen since World War II. (Photo: Oxford Economics)

Source: Exame

This article was produced by The Rio Times’ automated newsroom system. How we use AI · Report an error

Read More from The Rio Times

The Rio Times · Power Map
See who really holds power in Latin America
Click to open the Power Map

Rotate for Best Experience

This report is optimized for landscape viewing. Rotate your phone for the full experience.