IBOV 171,031.73 ▲ 1.85% IPSA 11,338.38 ▲ 0.89% IPC MEX 65,729.18 ▲ 2.14% MERVAL 2,913,184 ▲ 1.30% COLCAP 2,459.23 ▲ 0.61% BVL PERÚ 58,698.13 ▲ 2.60% USD/BRL5.14▲ 0.02% USD/MXN16.93▲ 0.09% USD/CLP914.28— 0.00% USD/COP3,043▲ 0.02% USD/PEN3.36▲ 0.05% USD/ARS1,499▼ 0.03% USD/UYU40.20— 0.00% USD/PYG5,996— 0.00% USD/BOB11.43— 0.00% USD/DOP58.61▼ 0.07% USD/CRC450.05— 0.00% USD/GTQ7.62— 0.00% USD/HNL26.81▲ 1.55% USD/NIO36.62— 0.00% USD/VES782.70▲ 0.48% USD/PAB1.00— 0.00% USD/BZD2.00— 0.00% USD/JMD 157.28 — 0.00% USD/TTD6.71— 0.00% EUR/BRL6.00▼ 0.03% BRENT 88.88 ▼ 0.03% WTI 83.11 ▼ 0.11% IRON ORE 161.91 — — COPPER 6.61 ▲ 0.03% GOLD 4,461 ▲ 1.78% SILVER 65.59 ▲ 1.26% SOY 1,184 ▲ 3.20% CORN 480.50 ▲ 10.02% WHEAT 655.00 ▲ 3.93% COFFEE 317.25 ▼ 5.51% SUGAR 16.43 ▼ 1.79% ORANGE JUICE 138.55 ▼ 0.47% COTTON 85.03 ▲ 2.33% COCOA 5,719 ▲ 3.18% BEEF 223.60 ▼ 3.93% CATTLE 339.10 ▼ 3.16% LITHIUM 75.20 ▲ 1.47% PETR4 41.64 ▼ 0.05% VALE3 72.97 ▲ 0.83% ITUB4 38.60 ▼ 1.03% BBDC4 16.85 ▲ 0.36% ABEV3 14.89 ▼ 0.80% BBAS3 19.37 ▲ 0.47% B3SA3 14.26 ▼ 0.21% WEGE3 47.59 ▲ 0.49% PRIO3 59.14 ▼ 0.19% SUZB3 41.33 ▲ 2.35% RENT3 34.68 ▼ 0.09% AZZA3 15.89 ▼ 2.63% CSAN3 3.22 ▼ 1.83% RAIZ4 0.25 — 0.00% PCAR3 2.75 ▼ 0.36% GMAT3 3.65 ▼ 1.08% PSSA3 48.13 ▼ 0.54% CVCB3 1.33 ▼ 2.92% POSI3 3.36 ▲ 2.44% SLCE3 13.34 ▲ 0.30% NATU3 8.14 ▼ 0.73% IBOV 171,031.73 ▲ 1.85% IPSA 11,338.38 ▲ 0.89% IPC MEX 65,729.18 ▲ 2.14% MERVAL 2,913,184 ▲ 1.30% COLCAP 2,459.23 ▲ 0.61% BVL PERÚ 58,698.13 ▲ 2.60% USD/BRL 5.16 ▲ 0.01% USD/MXN 17.06 ▼ 0.24% USD/CLP 913.98 ▲ 0.04% USD/COP 3,140 ▲ 0.03% USD/PEN 3.36 ▼ 0.66% USD/ARS 1,493 ▲ 0.10% USD/UYU 40.27 ▲ 1.24% USD/PYG 5,939 ▲ 1.68% USD/BOB 11.64 ▼ 0.76% USD/DOP 58.34 ▲ 1.25% USD/CRC 445.92 ▲ 0.89% USD/GTQ 7.62 ▲ 2.21% USD/HNL 26.79 ▲ 1.57% USD/NIO 36.62 ▲ 0.69% USD/VES 762.44 ▼ 0.13% USD/PAB 1.00 — 0.00% USD/BZD 2.00 — 0.00% USD/JMD 157.28 — 0.00% USD/TTD 6.70 ▲ 0.61% EUR/BRL 5.95 ▲ 1.01% BRENT 88.88 ▼ 0.03% WTI 83.11 ▼ 0.11% IRON ORE 161.91 — — COPPER 6.61 ▲ 0.03% GOLD 4,461 ▲ 1.78% SILVER 65.59 ▲ 1.26% SOY 1,184 ▲ 3.20% CORN 480.50 ▲ 10.02% WHEAT 655.00 ▲ 3.93% COFFEE 317.25 ▼ 5.51% SUGAR 16.43 ▼ 1.79% ORANGE JUICE 138.55 ▼ 0.47% COTTON 85.03 ▲ 2.33% COCOA 5,719 ▲ 3.18% BEEF 223.60 ▼ 3.93% CATTLE 339.10 ▼ 3.16% LITHIUM 75.20 ▲ 1.47% PETR4 41.64 ▼ 0.05% VALE3 72.97 ▲ 0.83% ITUB4 38.60 ▼ 1.03% BBDC4 16.85 ▲ 0.36% ABEV3 14.89 ▼ 0.80% BBAS3 19.37 ▲ 0.47% B3SA3 14.26 ▼ 0.21% WEGE3 47.59 ▲ 0.49% PRIO3 59.14 ▼ 0.19% SUZB3 41.33 ▲ 2.35% RENT3 34.68 ▼ 0.09% AZZA3 15.89 ▼ 2.63% CSAN3 3.22 ▼ 1.83% RAIZ4 0.25 — 0.00% PCAR3 2.75 ▼ 0.36% GMAT3 3.65 ▼ 1.08% PSSA3 48.13 ▼ 0.54% CVCB3 1.33 ▼ 2.92% POSI3 3.36 ▲ 2.44% SLCE3 13.34 ▲ 0.30% NATU3 8.14 ▼ 0.73%
since 2009
Monday, August 24, 2026

Brazil Business - Brazil

Research Shows Regional Decentralization in Brazilian Service Sector over Ten Years

By · August 29, 2019 · 3 min read

Daily Brief

The morning intel from across Latin America. Free.

By subscribing you agree to our privacy policy. We never share your email.

RIO DE JANEIRO, BRAZIL – Published yesterday, August 28th, by the Brazilian Institute of Geography and Statistics (IBGE), the Annual Services Survey (PAS 2017) shows regional decentralization between 2008 and 2017 in the structure of the sector.

This is an already expected natural trend, said Synthia Santana, IBGE’s Analysis and Dissemination Manager, to Agência Brasil. “You always expect regional decentralization. People and companies have always moved towards states and regions where production factors are more favorable and cheaper.”

the Southeast concentrated 65.6 percent of service revenue in the state of São Paulo, followed by Rio de Janeiro (20 percent), Minas Gerais (11.9 percent) and Espírito Santo (2.5 percent).
The Southeast concentrated 65.6 percent of service revenue in the state of São Paulo, followed by Rio de Janeiro (20 percent), Minas Gerais (11.9 percent), and Espírito Santo (2.5 percent). (Photo internet reproduction)
One-stop reference
Company Intelligence
Every listed company in Latin America — financials, ownership and structure for 1,450+ companies across 26 exchanges, in one place.
Browse the directory →
RT
Ask Rio Times
Latin American markets, currencies and companies.
Open the full Ask Rio Times →

According to the IBGE survey, the Brazilian Southeast is slowing down, while other regions are gaining dimension. The Southeast region experienced a decline in the ten-year period between 2008 and 2017 in the number of employed staff (from 60.4 percent of the total to 57 percent), in the number of companies (from 59.3 percent to 56.4 percent), in paid wages (from 67.3 percent to 63.3 percent) and in gross revenue from services (from 66.2 percent to 64.3 percent).

Based on the gross service revenue recorded among the states of each major region in the ten-year period between 2008 and 2017, it appears that the Southeast concentrated 65.6 percent of service revenue in the state of São Paulo, followed by Rio de Janeiro (20 percent), Minas Gerais (11.9 percent), and Espírito Santo (2.5 percent).

While São Paulo climbed one percentage point (pp) compared to 2008 and Rio de Janeiro remained stable, Minas Gerais and Espírito Santo dropped by 0.8 and 0.2 pp, respectively.

In the South, where the most significant structural change occurred in the country, Paraná began to lead the production of gross revenue from services in the region, with an increase of 2.2 pp, concentrating 39.3 percent and replacing Rio Grande do Sul, whose share fell 3.7 pp, accounting for 35.2 percent of total revenue.

In the Northeast, the provision of non-financial services is concentrated in Bahia (31.2 percent), Pernambuco (21.3 percent), and Ceará (17.1 percent). Together, these three states account for 69.6 percent of the regional gross revenue from services.

All northeastern states increased their share in the decade, except for Bahia. Synthia Santana reported, however, that even though losing 4.1 pp in share, Bahia is still the leading state in the generation of gross revenue from services in the Northeast.

She said that the Midwest, where the productive structure is quite uniform, is firmly rooted in the transportation sector and in auxiliary services to the natural inclination of agribusiness. The Federal District stands out, with a 36.2 percent share in the gross revenue from services generated in the region, concentrated in traditional services, despite a 7.1 pp retraction in ten years.
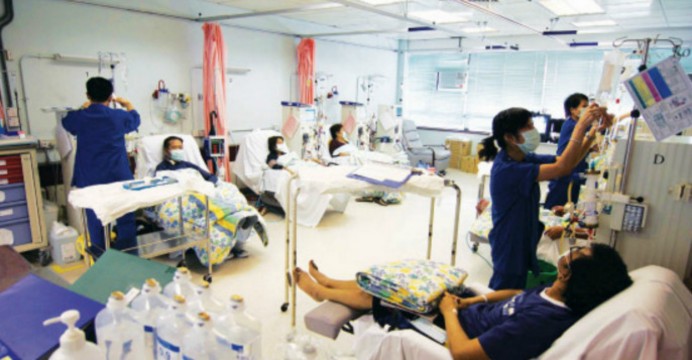
In the South, where the most significant structural change occurred in the country, Paraná began to lead the production of gross revenue from services in the region
In the South, where the most significant structural change occurred in the country, Paraná began to lead the production of gross revenue from services in the region. (Photo internet reproduction)

Conversely, the state of Mato Grosso saw its share increase by 7.2 pp in ten years to 22 percent, “rooted in the auxiliary services of agribusiness, which drives the full range of activities around it,” said the manager of IBGE. According to her, 62.1 percent of Mato Grosso’s gross revenue is generated from transportation.

In the North Region, Amazonas and Pará concentrate 36.3 percent and 37 percent of the region’s gross revenue, respectively.

The Amazonas share fell 3.6 pp in ten years. The main structural change has been the gain of 2.4 pp in revenue recorded in the state of Tocantins, over the same period. In 2008, Tocantins had a 5.3 percent share in the region’s gross revenue from services and, in 2017, it climbed to 7.7 percent.

This article was produced by The Rio Times’ automated newsroom system. How we use AI · Report an error

Read More from The Rio Times

The Rio Times · Power Map
See who really holds power in Latin America
Click to open the Power Map

Rotate for Best Experience

This report is optimized for landscape viewing. Rotate your phone for the full experience.