Life Expectancy in Latin American Cities: Between German Longevity and War Zone Mortality
RIO DE JANEIRO, BRAZIL – A study published in Nature Medicine uncovers differences of over a decade in life expectancy when comparing mortality in 363 locations across nine countries for the first time.

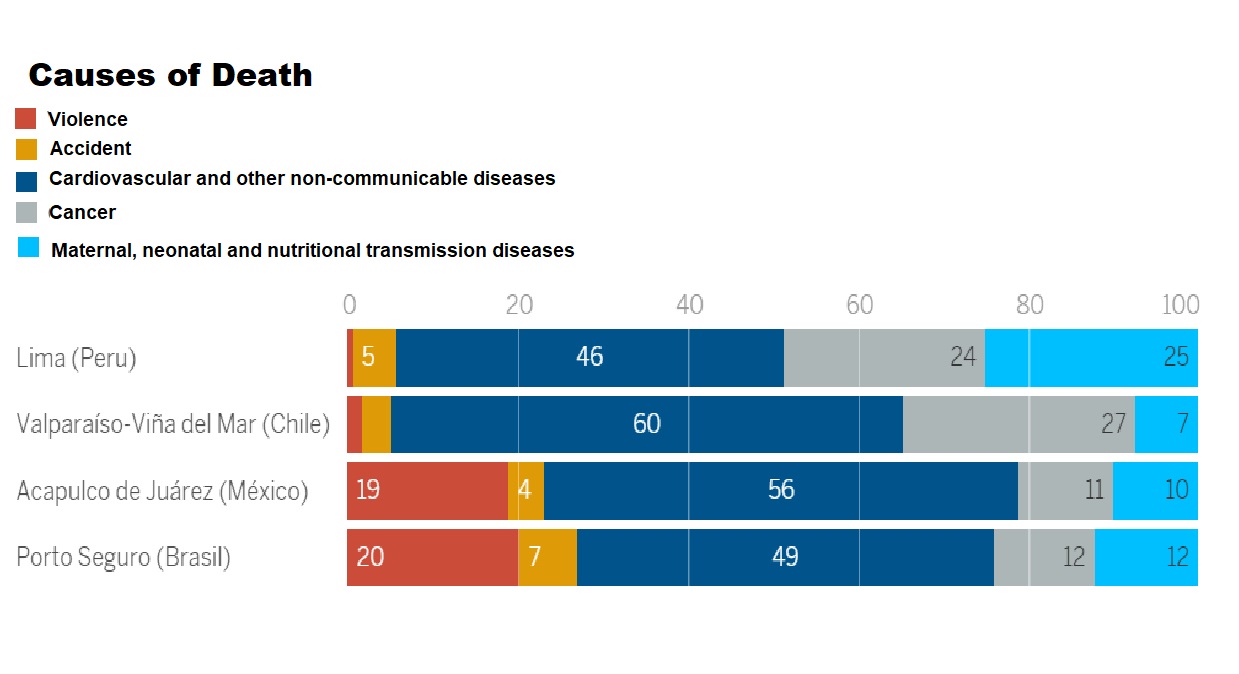
The Mexican paradise beach resort of Acapulco, the pearl of the Pacific, is a much desired tourist destination for its miles of sandstrips. However, beyond the hotels, the situation does not resemble paradise: 19% of deaths in the city are due to the violence that terrorizes its streets, one of the highest percentages in Latin America.
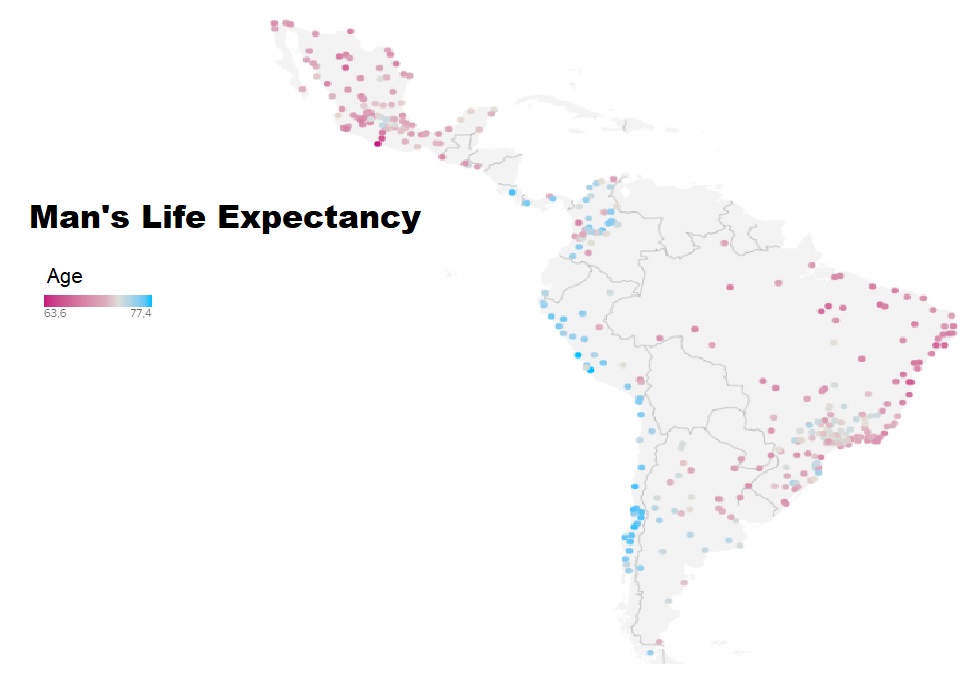
The life expectancy of a man born in Acapulco is only 63 years. It is 14 years less than in many cities in Chile, Peru and Costa Rica. It is an illustration of the immense inequalities found among Latin American cities, disclosed in a study published last Tuesday in Nature Medicine, which analyzes longevity and mortality in 363 cities across nine countries.
Violence is one of the most brutally unequal death causes on the continent. Cities like Acapulco and Porto Seguro (Brazil) stand out, with percentages similar to Iraq, while at the other end cities like Lima (Peru) and Valparaíso (Chile) stand out, with very low percentages and life expectancy levels comparable to wealthy countries. “What we do here is demonstrate that, depending on the city where one lives, one’s life expectancy varies greatly,” says one of the study’s authors, Usama Bilal, from Drexel University (USA). And although violence is highly associated with men, women are also victims. “The Mexican city with the lowest life expectancy for women is Juárez,” points out Bilal, referring to a place known precisely for its numerous feminicides.
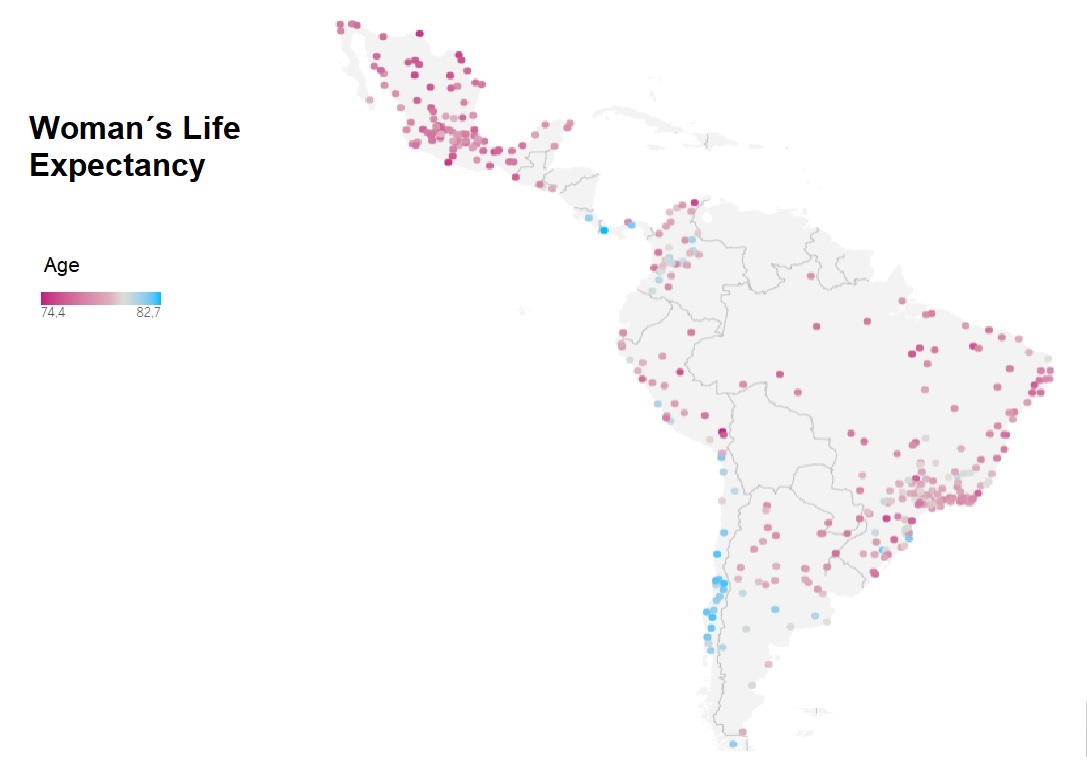
“We typically compare the life expectancy of countries where it is very high, such as Spain and Japan, with that of others where it is very low, such as Afghanistan and Botswana,” explains the epidemiologist. “But here we see that within the same country, such as Mexico or Brazil, there are cities with very high expectancies and cities with very low expectancies: we have numbers like in Germany and lower than in India, such as Acapulco. Inside Mexico, we have many different countries”, he adds.
Among the factors that draw the attention of researchers in all of these countries are also the differences in the causes of death among cities in the same country. The northern regions of Argentina, with a very high number of deaths from infectious diseases, have a very different profile than Buenos Aires. Brazil, for instance, shows very distinct violence patterns: few in the south and many in the north.
One aspect that stands out in this research is that it is not the city itself -in contrast to the rural areas- that produces health conditions, but rather the type of city. “Studies like this are important because they suggest that urban policies have an impact on health. Improving health in cities demands intervention policies that extend far beyond medical assistance,” points out Ana Diez Roux, principal researcher of the Salurbal project (Urban Health in Latin America). The sample is comprised of cities of over 100,000 inhabitants in the nine countries with scientists in the project: Colombia, Mexico, Chile, Peru, Brazil, Argentina, Costa Rica, Panama and El Salvador. Data from 2010 to 2016 were used in the study.
The researchers analyzed which factors are associated with the level of life expectancy and found that the most decisive is what they refer to as social environment index, a combination of four indicators: the proportion of people who have completed elementary school, who have running water in their homes, who live in a house connected to a sewage system and, finally, the proportion of inhabitants living in overcrowded spaces.
“This shows whether the city is more developed, economically and socially. And we see that it greatly influences life expectancy,” summarizes Bilal, who was granted US$2 million in 2018 to study how cities impact people’s health. The project involves the study of over 700 cities across the American continent, including the U.S.
The same team published another study in December 2019 in which it analyzed these same factors within cities, and found evidence that a woman living in one of the least favored areas of Santiago, Chile, will live 18 years less than another living in a wealthy neighborhood in the same city. “We see a difference of up to 14 years of life between cities, but if we were to look inside the cities, we would notice even greater inequality: if we compared the poor of Acapulco with the wealthy of Santiago, the differences would be much higher,” notes Bilal.
One of the main problems researchers faced when collecting and analyzing data is the underreporting phenomenon: not all deaths are registered. “If they are not accounted for, it may seem that life expectancy is higher than it truly is. It is a very big problem in Peru, where a high percentage of deaths, around 40%, had not been registered,” says Bilal. Although they have applied statistical methods to correct the rates, this may explain why there are Peruvian cities where men’s life expectancy is very high.
Source: El Pais
More: Brazil news in English, every day from The Rio Times.
This article was produced by The Rio Times’ automated AI newsroom. Editorial responsibility: Matthias Camenzind, Publisher and Editor-in-Chief. The Rio Times also runs Ask Rio Times, which answers from 100,000+ of our own articles, the daily Latin America Power Map, and prediction-market odds on elections and markets.. How we use AI · Report an error
Brazil runoff, Sunday, October 25: Brazil runoff date. Latest: Brazil runoff polls, Flávio 51%, Lula 49%.