Almost Half the World has no Internet Access, Says Study
RIO DE JANEIRO, BRAZIL – It was the first year in which connectivity exceeded 50 percent. However, the index shows that, despite the fact that the World Wide Web has gained importance in the most diverse social spheres over the past 20 years, almost half of the population still does not dispose of this resource.
The information is introduced and discussed in the report “Broadband State 2019”, of the Broadband Commission, a group that includes company representatives and the United Nations.

When households are taken into account, the index increases, reaching 57.8 percent. In 2005, 19 percent of homes were surfing the web. However, when the fixed broadband is factored in, the percentage drops to 14 percent.
On the other hand, connectivity growth in homes slowed, having dropped from 53 percent to 54.8 percent between 2017 and 2018. In poorer countries, the growth rate fell from 19 percent in 2017 to 17.5 percent in 2018.
The analysis of households served by fixed broadband services is considered important by researchers since mobile connections, in general, are limited to the full enjoyment of services, such as services restricting the use, for instance, of videos in sufficient number.
Broadband is the term used for connectivity with a speed of at least 256 kbps and that ensures a minimum set of online activities, such as website visits and communication apps. The rate of 51 percent is still far from the goal of reaching 75 percent by 2025.
Inequalities
The report points out that in addition to half of the population being offline, there are significant inequalities among those connected.
“The gaps in the adoption of connectivity are driven by gaps of different types: geography (urban x rural areas), income (rich x poor), age and gender, among others,” the report highlights.
While the poor-quality connection was pointed out by 43 percent in poorer countries, the problem was mentioned by 25 percent of respondents in richer nations.
Another clearer example is the price of packages between different regions of the globe. While the price of a 1-gigabyte service in South Asian countries takes up 1.2 percent of average monthly income, in sub-Saharan Africa the service costs the equivalent of 6.8 percent of average monthly income.
Better Infrastructure
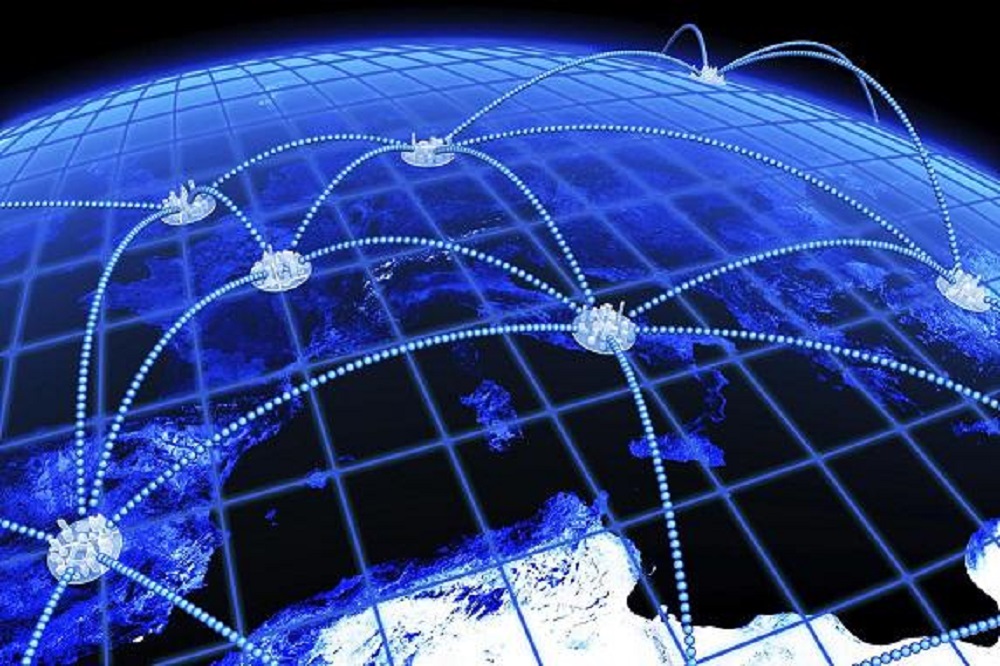
However, according to the report, the infrastructure has progressed and is now present in locations covering 96 percent of the world’s population. International data traffic is carried by 400 submarine cables, covering 1.2 million kilometers, and by 775 satellites operating communication services in the Earth’s orbit.
In the mobile ecosystem, 2018 was the year in which 4G technology became dominant, surpassing 2G, accounting for 44 percent of mobile connections. Quoting data from the GSMA consultancy, the document points out that 5G, the new technological paradigm of mobile services, has become “a reality”.
Last year, the new standard was launched in the United States and South Korea. In 2019, it is expected to be offered in 16 new countries. The GSMA expects that by 2025 there will be 1.4 billion connections, about 15 percent of the total base.
For the authors, the Internet is at a “crossroads”.
“There is growing awareness that challenges and risks require specific policies and regulations, as well as new business approaches and industry initiatives aimed at mitigating unintended effects and negative outcomes of Internet adoption.
The report stresses that people can not only be divided between users and non-users but that the diversity of connectivity forms and online experiences must be grasped. The awareness of these specificities requires the consideration of the most vulnerable audiences in their presence on the web.
Women are subject to persecution, harassment and hate speech on the Internet. Children are victims of abuse, exploitation, and bullying.
Faced with a variety of access methods, the authors advocate what they term “relevant universal connectivity”. This notion involves broadband that is “available, accessible, relevant, inexpensive, secure, reliable and empowers users leading to positive impacts”.
This perception also takes into account not only the cost but different drivers for connecting and having quality experiences in the online environment.
Considering the variety of experiences, the report provides data on different types of activities on the web. The exchange of messages by apps like WhatsApp and FB Messenger are the most popular, followed by social media, online link, and reading news.
Actions vary by income, with information retrieval and product purchasing being more common in wealthier countries.
Source: Agência Brasil
More: Brazil news in English, every day from The Rio Times.
This article was produced by The Rio Times’ automated newsroom system. How we use AI · Report an error · Editorial responsibility: Matthias Camenzind, Editor-in-Chief
LatAm Markets: Live Signals → — real-time movers, turnover leaders and FX across Latin America.