IBOV 171,031.73 ▲ 1.85% IPSA 11,338.38 ▲ 0.89% IPC MEX 65,729.18 ▲ 2.14% MERVAL 2,913,184 ▲ 1.30% COLCAP 2,459.23 ▲ 0.61% BVL PERÚ 58,698.13 ▲ 2.60% USD/BRL5.14▼ 0.14% USD/MXN16.90▼ 0.36% USD/CLP914.28— 0.00% USD/COP3,038▼ 1.18% USD/PEN3.35▼ 0.06% USD/ARS1,499▲ 0.12% USD/UYU40.20▲ 1.58% USD/PYG5,996▲ 1.55% USD/BOB11.43▲ 0.41% USD/DOP58.82▲ 0.20% USD/CRC450.05▲ 3.34% USD/GTQ7.62▲ 2.21% USD/HNL26.81▲ 0.31% USD/NIO36.62▲ 0.61% USD/VES778.00▼ 0.13% USD/PAB1.00— 0.00% USD/BZD2.00— 0.00% USD/JMD 157.28 — 0.00% USD/TTD6.71▲ 0.79% EUR/BRL6.00▼ 0.64% BRENT 88.88 ▼ 0.03% WTI 83.11 ▼ 0.11% IRON ORE 161.91 — — COPPER 6.61 ▲ 0.03% GOLD 4,461 ▲ 1.78% SILVER 65.59 ▲ 1.26% SOY 1,184 ▲ 3.20% CORN 480.50 ▲ 10.02% WHEAT 655.00 ▲ 3.93% COFFEE 317.25 ▼ 5.51% SUGAR 16.43 ▼ 1.79% ORANGE JUICE 138.55 ▼ 0.47% COTTON 85.03 ▲ 2.33% COCOA 5,719 ▲ 3.18% BEEF 223.60 ▼ 3.93% CATTLE 339.10 ▼ 3.16% LITHIUM 75.20 ▲ 1.47% PETR4 41.64 ▼ 0.05% VALE3 72.97 ▲ 0.83% ITUB4 38.60 ▼ 1.03% BBDC4 16.85 ▲ 0.36% ABEV3 14.89 ▼ 0.80% BBAS3 19.37 ▲ 0.47% B3SA3 14.26 ▼ 0.21% WEGE3 47.59 ▲ 0.49% PRIO3 59.14 ▼ 0.19% SUZB3 41.33 ▲ 2.35% RENT3 34.68 ▼ 0.09% AZZA3 15.89 ▼ 2.63% CSAN3 3.22 ▼ 1.83% RAIZ4 0.25 — 0.00% PCAR3 2.75 ▼ 0.36% GMAT3 3.65 ▼ 1.08% PSSA3 48.13 ▼ 0.54% CVCB3 1.33 ▼ 2.92% POSI3 3.36 ▲ 2.44% SLCE3 13.34 ▲ 0.30% NATU3 8.14 ▼ 0.73% IBOV 171,031.73 ▲ 1.85% IPSA 11,338.38 ▲ 0.89% IPC MEX 65,729.18 ▲ 2.14% MERVAL 2,913,184 ▲ 1.30% COLCAP 2,459.23 ▲ 0.61% BVL PERÚ 58,698.13 ▲ 2.60% USD/BRL 5.16 ▲ 0.01% USD/MXN 17.06 ▼ 0.24% USD/CLP 913.98 ▲ 0.04% USD/COP 3,140 ▲ 0.03% USD/PEN 3.36 ▼ 0.66% USD/ARS 1,493 ▲ 0.10% USD/UYU 40.27 ▲ 1.24% USD/PYG 5,939 ▲ 1.68% USD/BOB 11.64 ▼ 0.76% USD/DOP 58.34 ▲ 1.25% USD/CRC 445.92 ▲ 0.89% USD/GTQ 7.62 ▲ 2.21% USD/HNL 26.79 ▲ 1.57% USD/NIO 36.62 ▲ 0.69% USD/VES 762.44 ▼ 0.13% USD/PAB 1.00 — 0.00% USD/BZD 2.00 — 0.00% USD/JMD 157.28 — 0.00% USD/TTD 6.70 ▲ 0.61% EUR/BRL 5.95 ▲ 1.01% BRENT 88.88 ▼ 0.03% WTI 83.11 ▼ 0.11% IRON ORE 161.91 — — COPPER 6.61 ▲ 0.03% GOLD 4,461 ▲ 1.78% SILVER 65.59 ▲ 1.26% SOY 1,184 ▲ 3.20% CORN 480.50 ▲ 10.02% WHEAT 655.00 ▲ 3.93% COFFEE 317.25 ▼ 5.51% SUGAR 16.43 ▼ 1.79% ORANGE JUICE 138.55 ▼ 0.47% COTTON 85.03 ▲ 2.33% COCOA 5,719 ▲ 3.18% BEEF 223.60 ▼ 3.93% CATTLE 339.10 ▼ 3.16% LITHIUM 75.20 ▲ 1.47% PETR4 41.64 ▼ 0.05% VALE3 72.97 ▲ 0.83% ITUB4 38.60 ▼ 1.03% BBDC4 16.85 ▲ 0.36% ABEV3 14.89 ▼ 0.80% BBAS3 19.37 ▲ 0.47% B3SA3 14.26 ▼ 0.21% WEGE3 47.59 ▲ 0.49% PRIO3 59.14 ▼ 0.19% SUZB3 41.33 ▲ 2.35% RENT3 34.68 ▼ 0.09% AZZA3 15.89 ▼ 2.63% CSAN3 3.22 ▼ 1.83% RAIZ4 0.25 — 0.00% PCAR3 2.75 ▼ 0.36% GMAT3 3.65 ▼ 1.08% PSSA3 48.13 ▼ 0.54% CVCB3 1.33 ▼ 2.92% POSI3 3.36 ▲ 2.44% SLCE3 13.34 ▲ 0.30% NATU3 8.14 ▼ 0.73%
since 2009
Saturday, August 22, 2026

Brazil’s foreign trade dropped more than global average in 2020 – CNI survey

By · May 24, 2021 · 2 min read

Daily Brief

The morning intel from across Latin America. Free.

By subscribing you agree to our privacy policy. We never share your email.

RIO DE JANEIRO, BRAZIL – The Covid-19 pandemic has impacted Brazil’s trade with other countries above the world average. Last year, the Brazilian trade flow (sum of imports and exports) fell 8.2%, according to a survey by the National Confederation of Industry (CNI), based on recent figures from the World Trade Organization (WTO).
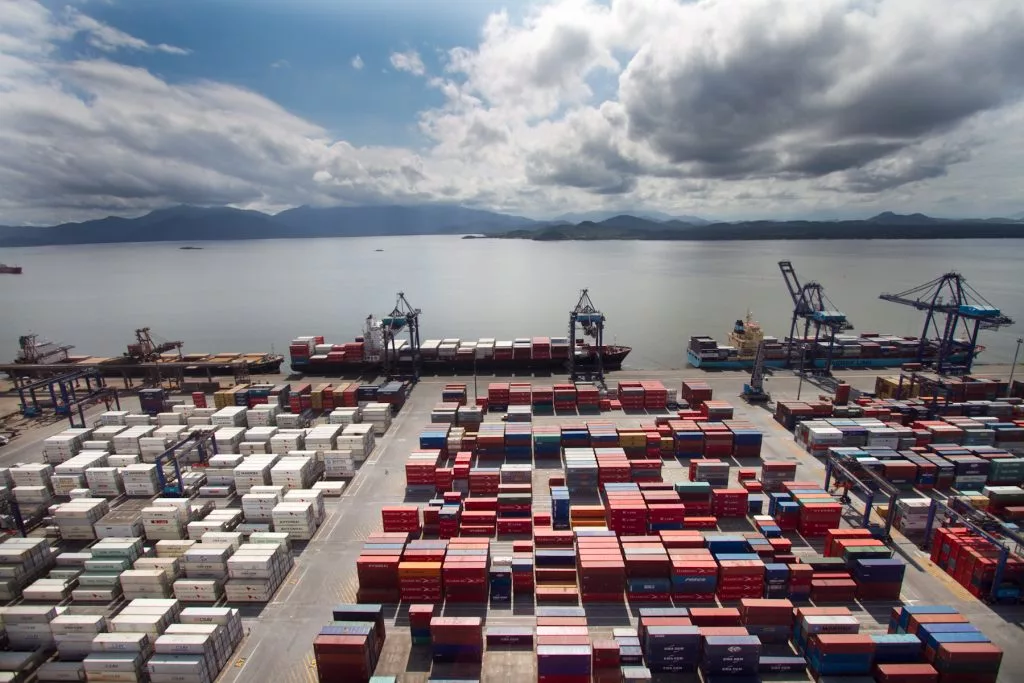
Despite the decrease in trade flow, Brazil remained in 27th place in the world trade ranking (Photo internet reproduction)
One-stop reference
Company Intelligence
Every listed company in Latin America — financials, ownership and structure for 1,450+ companies across 26 exchanges, in one place.
Browse the directory →
RT
Ask Rio Times
Latin American markets, currencies and companies.
Open the full Ask Rio Times →

The variation is higher than the 7.6% contraction in world trade flow in 2020. Compared to the other members of the G20 (group of the 20 largest economies on the planet), the scenario is no better for Brazil. Last year, trade flow among the group’s members decreased by 8% compared to 2019.

The slump in Brazil’s trade flow results from a 7% drop in exports and a 10% drop in imports last year.

The decline in foreign sales is due to the disruption of trade chains and the drop in international trade, particularly in the first months of the pandemic.

On the imports front, the main factor was the devaluation of the Brazilian real, which increased the price of foreign products.

Despite the decrease in trade flow, Brazil remained in 27th place in the world trade ranking. Last year, the country held a 1% share in the global export and import flow.

Leadership

Among the G20 countries, China was the only to post growth in trade flow in 2020, reflecting the country’s integration into global value chains.

With a 4% growth in exports and 1% in imports, the country posted a flow of US$4.6 trillion last year and saw its share in world trade rise from 12% to 13%, preserving its leadership in the ranking.

In second place in world trade was the United States. Although the country’s trade flow declined, the country exported and imported US$3.8 trillion last year and concentrated 11% of world trade. Germany closed 2020 in 3rd place, with 7% of global trade, and Japan in 4th, with 4%.

Across the planet, also as a reflection of the pandemic, trade in goods reached its lowest level since 2016 in 2020, with its entire value chain affected.

Trade flow totaled US$35.4 trillion, down 7.6% from 2019. World exports fell by 7.5%, while imports dropped by 7.6%.

Outlook

To improve Brazil’s global trade integration, CNI advocates internal and external policies. Domestically, the organization recommends the progress of structural reforms, particularly the tax reform, and the elimination of bottlenecks that create the “Brazil cost”, through the modernization of infrastructure.

In the external sphere, the foreign trade agenda includes measures to reduce bureaucracy, lower tariffs, improve financing, and close trade agreements to reduce barriers to Brazilian products abroad.

According to CNI, the improvement of Brazilian exports also depends on the post-pandemic global economic recovery. According to the organization, Brazil’s main trade partners, such as the United States, Europe and other Latin American countries, need to resume growth in the coming years.

This article was produced by The Rio Times’ automated newsroom system. How we use AI · Report an error

Read More from The Rio Times

The Rio Times · Power Map
See who really holds power in Latin America
Click to open the Power Map

Rotate for Best Experience

This report is optimized for landscape viewing. Rotate your phone for the full experience.