IBOV 171,031.73 ▲ 1.85% IPSA 11,338.38 ▲ 0.89% IPC MEX 65,729.18 ▲ 2.14% MERVAL 2,913,184 ▲ 1.30% COLCAP 2,459.23 ▲ 0.61% BVL PERÚ 58,698.13 ▲ 2.60% USD/BRL5.14▼ 0.14% USD/MXN16.95▲ 0.30% USD/CLP914.28— 0.00% USD/COP3,038▼ 1.18% USD/PEN3.35▼ 0.06% USD/ARS1,499▲ 0.12% USD/UYU40.20▲ 1.58% USD/PYG5,996▲ 1.55% USD/BOB11.43▲ 0.41% USD/DOP58.82▲ 0.20% USD/CRC450.05▲ 3.34% USD/GTQ7.62▲ 2.21% USD/HNL26.81▲ 0.31% USD/NIO36.62▲ 0.61% USD/VES778.00▼ 0.13% USD/PAB1.00— 0.00% USD/BZD2.00— 0.00% USD/JMD 157.28 — 0.00% USD/TTD6.71▲ 0.79% EUR/BRL6.00▼ 0.64% BRENT 88.88 ▼ 0.03% WTI 83.11 ▼ 0.11% IRON ORE 161.91 — — COPPER 6.61 ▲ 0.03% GOLD 4,461 ▲ 1.78% SILVER 65.59 ▲ 1.26% SOY 1,184 ▲ 3.20% CORN 480.50 ▲ 10.02% WHEAT 655.00 ▲ 3.93% COFFEE 317.25 ▼ 5.51% SUGAR 16.43 ▼ 1.79% ORANGE JUICE 138.55 ▼ 0.47% COTTON 85.03 ▲ 2.33% COCOA 5,719 ▲ 3.18% BEEF 223.60 ▼ 3.93% CATTLE 339.10 ▼ 3.16% LITHIUM 75.20 ▲ 1.47% PETR4 41.64 ▼ 0.05% VALE3 72.97 ▲ 0.83% ITUB4 38.60 ▼ 1.03% BBDC4 16.85 ▲ 0.36% ABEV3 14.89 ▼ 0.80% BBAS3 19.37 ▲ 0.47% B3SA3 14.26 ▼ 0.21% WEGE3 47.59 ▲ 0.49% PRIO3 59.14 ▼ 0.19% SUZB3 41.33 ▲ 2.35% RENT3 34.68 ▼ 0.09% AZZA3 15.89 ▼ 2.63% CSAN3 3.22 ▼ 1.83% RAIZ4 0.25 — 0.00% PCAR3 2.75 ▼ 0.36% GMAT3 3.65 ▼ 1.08% PSSA3 48.13 ▼ 0.54% CVCB3 1.33 ▼ 2.92% POSI3 3.36 ▲ 2.44% SLCE3 13.34 ▲ 0.30% NATU3 8.14 ▼ 0.73% IBOV 171,031.73 ▲ 1.85% IPSA 11,338.38 ▲ 0.89% IPC MEX 65,729.18 ▲ 2.14% MERVAL 2,913,184 ▲ 1.30% COLCAP 2,459.23 ▲ 0.61% BVL PERÚ 58,698.13 ▲ 2.60% USD/BRL 5.16 ▲ 0.01% USD/MXN 17.06 ▼ 0.24% USD/CLP 913.98 ▲ 0.04% USD/COP 3,140 ▲ 0.03% USD/PEN 3.36 ▼ 0.66% USD/ARS 1,493 ▲ 0.10% USD/UYU 40.27 ▲ 1.24% USD/PYG 5,939 ▲ 1.68% USD/BOB 11.64 ▼ 0.76% USD/DOP 58.34 ▲ 1.25% USD/CRC 445.92 ▲ 0.89% USD/GTQ 7.62 ▲ 2.21% USD/HNL 26.79 ▲ 1.57% USD/NIO 36.62 ▲ 0.69% USD/VES 762.44 ▼ 0.13% USD/PAB 1.00 — 0.00% USD/BZD 2.00 — 0.00% USD/JMD 157.28 — 0.00% USD/TTD 6.70 ▲ 0.61% EUR/BRL 5.95 ▲ 1.01% BRENT 88.88 ▼ 0.03% WTI 83.11 ▼ 0.11% IRON ORE 161.91 — — COPPER 6.61 ▲ 0.03% GOLD 4,461 ▲ 1.78% SILVER 65.59 ▲ 1.26% SOY 1,184 ▲ 3.20% CORN 480.50 ▲ 10.02% WHEAT 655.00 ▲ 3.93% COFFEE 317.25 ▼ 5.51% SUGAR 16.43 ▼ 1.79% ORANGE JUICE 138.55 ▼ 0.47% COTTON 85.03 ▲ 2.33% COCOA 5,719 ▲ 3.18% BEEF 223.60 ▼ 3.93% CATTLE 339.10 ▼ 3.16% LITHIUM 75.20 ▲ 1.47% PETR4 41.64 ▼ 0.05% VALE3 72.97 ▲ 0.83% ITUB4 38.60 ▼ 1.03% BBDC4 16.85 ▲ 0.36% ABEV3 14.89 ▼ 0.80% BBAS3 19.37 ▲ 0.47% B3SA3 14.26 ▼ 0.21% WEGE3 47.59 ▲ 0.49% PRIO3 59.14 ▼ 0.19% SUZB3 41.33 ▲ 2.35% RENT3 34.68 ▼ 0.09% AZZA3 15.89 ▼ 2.63% CSAN3 3.22 ▼ 1.83% RAIZ4 0.25 — 0.00% PCAR3 2.75 ▼ 0.36% GMAT3 3.65 ▼ 1.08% PSSA3 48.13 ▼ 0.54% CVCB3 1.33 ▼ 2.92% POSI3 3.36 ▲ 2.44% SLCE3 13.34 ▲ 0.30% NATU3 8.14 ▼ 0.73%
since 2009
Sunday, August 23, 2026

Brazil Politics - Brazil

Education, Health, and Economics Ministries Have 70 Percent of Federal Staff Costs

By · June 24, 2019 · 2 min read

Daily Brief

The morning intel from across Latin America. Free.

By subscribing you agree to our privacy policy. We never share your email.

By Xiu Ying

RIO DE JANEIRO, BRAZIL – According to government data, the Ministries of Education, Health and Economy account for 81.4 percent of the entire workforce of the country’s Ministries. Of the 622,534 active civil servants, 507,106 are in these portfolios.
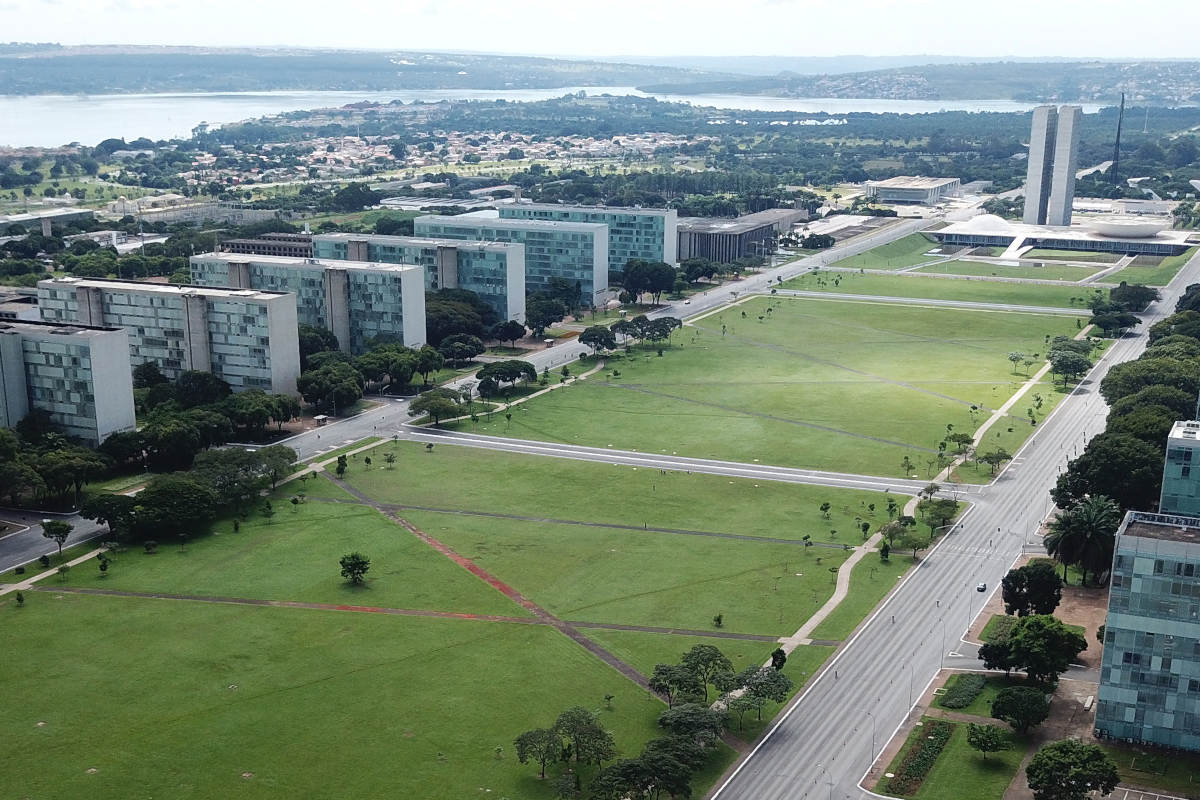
"Esplanada dos Ministérios" - the headquarters of all Ministries in Brasília.
“Esplanada dos Ministérios” – the headquarters of all federal ministries in Brasília. (Photo internet reproduction)
One-stop reference
Company Intelligence
Every listed company in Latin America — financials, ownership and structure for 1,450+ companies across 26 exchanges, in one place.
Browse the directory →
RT
Ask Rio Times
This story and the bigger picture.
Open the full Ask Rio Times →

The Ministry of Education (MEC) employs 300,833 workers, the Ministry of Health 104,130, and the Ministry of Economy 102,143.

Education, Health, and Economics spent R$50.9 billion (US$12.7 billion) on payroll in the first five months of this year. The rate represents 72.7 percent of total spending on wages and benefits, which totaled R$70 billion between January and May of this year.

Despite the high concentration of civil servants in three portfolios, the federal government believes that the distribution is justified.

“The Ministry of Education also includes all universities and federal educational institutions, for instance. The Ministry of Health includes employees of the Oswaldo Cruz Foundation (Fiocruz), the National Health Foundation (Funasa) and the National Supplementary Health Agency (ANS). Finally, the Ministry of Economy includes the Brazilian Institute of Geography and Statistics (IBGE) and the Social Security Administration (INSS),” the government explains in a note.

Transparency Portal has other Data

The data used by the government to determine the dimensions of its employees, differ from those published on the Transparency Portal. A Metrópoles Survey found that the Ministries of Defense (412,000), Education (379,000) and Economy (112,000) account for 84 percent of civil servants, whereas Health, according to this database, is in fourth place. In all, they spent R$42 billion on payroll this year, according to the government agency.

According to the Ministry of Economy, these platforms use different databases. “The Transparency Portal uses a different criterion from the Statistical Personnel Panel (PEP) to disclose data on federal civil servants. The first uses the number of employment relationships and includes the military. In this case, for instance, a servant may have more than one employe. The second, on the other hand, provides data from civil servants (amount, expenses, admissions, retirements, etc.),” emphasizes the Ministry, in a note.

The text also states that figures from the Ministry of Defense may include military servants. “Concerning the Defense’s active civil servants, there are currently 17,223 (PEP data),” it states. The Ministry of Defense and the Armed Forces spent R$27.3 billion on active personnel in 2018. The forecast for 2019 is R$ 29.3 billion.

Read More from The Rio Times

The Rio Times · Power Map
See who really holds power in Latin America
Click to open the Power Map

Rotate for Best Experience

This report is optimized for landscape viewing. Rotate your phone for the full experience.