IBOV 171,031.73 ▲ 1.85% IPSA 11,338.38 ▲ 0.89% IPC MEX 65,729.18 ▲ 2.14% MERVAL 2,913,184 ▲ 1.30% COLCAP 2,459.23 ▲ 0.61% BVL PERÚ 58,698.13 ▲ 2.60% USD/BRL5.14— 0.00% USD/MXN16.92▲ 0.08% USD/CLP914.28— 0.00% USD/COP3,044▲ 0.21% USD/PEN3.36▲ 0.04% USD/ARS1,499▼ 0.03% USD/UYU40.20▲ 1.52% USD/PYG5,996▲ 1.39% USD/BOB11.43▲ 0.51% USD/DOP58.61▼ 0.07% USD/CRC450.05▲ 1.95% USD/GTQ7.62▲ 2.13% USD/HNL26.81▲ 1.55% USD/NIO36.62— 0.00% USD/VES782.70▼ 0.13% USD/PAB1.00— 0.00% USD/BZD2.00— 0.00% USD/JMD 157.28 — 0.00% USD/TTD6.71▲ 0.82% EUR/BRL6.00▲ 0.03% BRENT 88.88 ▼ 0.03% WTI 83.11 ▼ 0.11% IRON ORE 161.91 — — COPPER 6.61 ▲ 0.03% GOLD 4,461 ▲ 1.78% SILVER 65.59 ▲ 1.26% SOY 1,184 ▲ 3.20% CORN 480.50 ▲ 10.02% WHEAT 655.00 ▲ 3.93% COFFEE 317.25 ▼ 5.51% SUGAR 16.43 ▼ 1.79% ORANGE JUICE 138.55 ▼ 0.47% COTTON 85.03 ▲ 2.33% COCOA 5,719 ▲ 3.18% BEEF 223.60 ▼ 3.93% CATTLE 339.10 ▼ 3.16% LITHIUM 75.20 ▲ 1.47% PETR4 41.64 ▼ 0.05% VALE3 72.97 ▲ 0.83% ITUB4 38.60 ▼ 1.03% BBDC4 16.85 ▲ 0.36% ABEV3 14.89 ▼ 0.80% BBAS3 19.37 ▲ 0.47% B3SA3 14.26 ▼ 0.21% WEGE3 47.59 ▲ 0.49% PRIO3 59.14 ▼ 0.19% SUZB3 41.33 ▲ 2.35% RENT3 34.68 ▼ 0.09% AZZA3 15.89 ▼ 2.63% CSAN3 3.22 ▼ 1.83% RAIZ4 0.25 — 0.00% PCAR3 2.75 ▼ 0.36% GMAT3 3.65 ▼ 1.08% PSSA3 48.13 ▼ 0.54% CVCB3 1.33 ▼ 2.92% POSI3 3.36 ▲ 2.44% SLCE3 13.34 ▲ 0.30% NATU3 8.14 ▼ 0.73% IBOV 171,031.73 ▲ 1.85% IPSA 11,338.38 ▲ 0.89% IPC MEX 65,729.18 ▲ 2.14% MERVAL 2,913,184 ▲ 1.30% COLCAP 2,459.23 ▲ 0.61% BVL PERÚ 58,698.13 ▲ 2.60% USD/BRL 5.16 ▲ 0.01% USD/MXN 17.06 ▼ 0.24% USD/CLP 913.98 ▲ 0.04% USD/COP 3,140 ▲ 0.03% USD/PEN 3.36 ▼ 0.66% USD/ARS 1,493 ▲ 0.10% USD/UYU 40.27 ▲ 1.24% USD/PYG 5,939 ▲ 1.68% USD/BOB 11.64 ▼ 0.76% USD/DOP 58.34 ▲ 1.25% USD/CRC 445.92 ▲ 0.89% USD/GTQ 7.62 ▲ 2.21% USD/HNL 26.79 ▲ 1.57% USD/NIO 36.62 ▲ 0.69% USD/VES 762.44 ▼ 0.13% USD/PAB 1.00 — 0.00% USD/BZD 2.00 — 0.00% USD/JMD 157.28 — 0.00% USD/TTD 6.70 ▲ 0.61% EUR/BRL 5.95 ▲ 1.01% BRENT 88.88 ▼ 0.03% WTI 83.11 ▼ 0.11% IRON ORE 161.91 — — COPPER 6.61 ▲ 0.03% GOLD 4,461 ▲ 1.78% SILVER 65.59 ▲ 1.26% SOY 1,184 ▲ 3.20% CORN 480.50 ▲ 10.02% WHEAT 655.00 ▲ 3.93% COFFEE 317.25 ▼ 5.51% SUGAR 16.43 ▼ 1.79% ORANGE JUICE 138.55 ▼ 0.47% COTTON 85.03 ▲ 2.33% COCOA 5,719 ▲ 3.18% BEEF 223.60 ▼ 3.93% CATTLE 339.10 ▼ 3.16% LITHIUM 75.20 ▲ 1.47% PETR4 41.64 ▼ 0.05% VALE3 72.97 ▲ 0.83% ITUB4 38.60 ▼ 1.03% BBDC4 16.85 ▲ 0.36% ABEV3 14.89 ▼ 0.80% BBAS3 19.37 ▲ 0.47% B3SA3 14.26 ▼ 0.21% WEGE3 47.59 ▲ 0.49% PRIO3 59.14 ▼ 0.19% SUZB3 41.33 ▲ 2.35% RENT3 34.68 ▼ 0.09% AZZA3 15.89 ▼ 2.63% CSAN3 3.22 ▼ 1.83% RAIZ4 0.25 — 0.00% PCAR3 2.75 ▼ 0.36% GMAT3 3.65 ▼ 1.08% PSSA3 48.13 ▼ 0.54% CVCB3 1.33 ▼ 2.92% POSI3 3.36 ▲ 2.44% SLCE3 13.34 ▲ 0.30% NATU3 8.14 ▼ 0.73%
since 2009
Monday, August 24, 2026

Life & Society Politics - Brazil

São Paulo State Takes First Place in Three Competitiveness Ranking Categories

By · October 19, 2019 · 2 min read

Daily Brief

The morning intel from across Latin America. Free.

By subscribing you agree to our privacy policy. We never share your email.

SÃO PAULO, BRAZIL – The state of São Paulo ranked first in the 2019 State Competitiveness Ranking, prepared by ‘CLP – Public Leadership’ to gather data on issues and challenges faced by key areas of public administration.

São Paulo State is located in the Southeastern Region of Brazil.
São Paulo State is located in the Southeast Region of Brazil. (Photo: internet reproduction)
One-stop reference
Company Intelligence
Every listed company in Latin America — financials, ownership and structure for 1,450+ companies across 26 exchanges, in one place.
Browse the directory →
RT
Ask Rio Times
This story and the bigger picture.
Open the full Ask Rio Times →

Ten key issues considered essential for promoting competitiveness and improving public management in the Brazilian states are assessed: infrastructure, social sustainability, public safety, education, fiscal soundness, the efficiency of government machinery, human capital, environmental sustainability, market potential, and innovation.

São Paulo remains at the top in infrastructure, regarded as one of the main challenges for improving competitiveness. This is the fifth consecutive year that the state has taken the first position in this category. The highlight is due to the good positioning in \fuel cost, availability of direct flights, quality of highways and accessibility of telecommunications service indicators. However, São Paulo is poorly placed in the telecommunications service quality and electric power quality items, which also are part of the assessment.

In the education category, São Paulo is first in the education assessment indicators, Basic Education Development Index (IDEB), National High School Examination (ENEM), Education Opportunity Index, secondary school net attendance rate and child education attendance rate. In terms of innovation, the ranking is assigned to São Paulo due to the fact that the state remained in first place in the investment in research and development (R&D) indicator, even after having dropped one position in relation to the ranking’s previous edition and was fourth in the patent indicator and sixth in the master and doctoral scholarship.
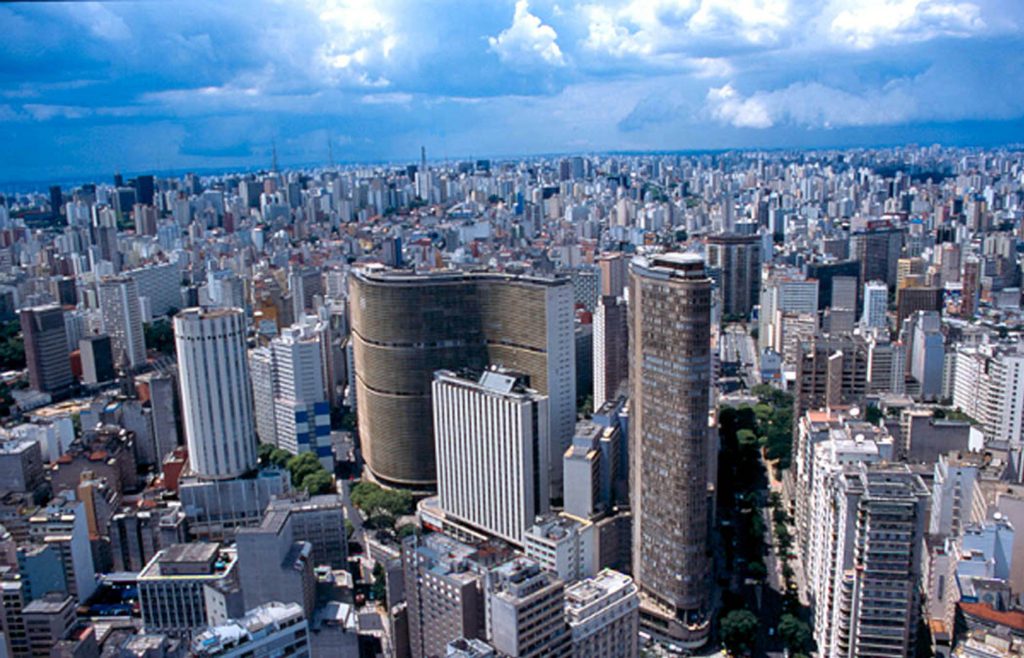
São Paulo City is the capital of São Paulo State.
São Paulo City is the capital of São Paulo State. (Photo: internet reproduction)

In the public safety category, the state of São Paulo lost first place in 2018, slipping to third place. The indicators influencing the result were arrests without conviction, prison deficit, deaths to be resolved and traffic fatalities. The state also lost positions in the social sustainability aspects (from the third place because of inadequate housing, families below the poverty line, income inequality and potential years of life lost), fiscal soundness (from 12th to 14th) and efficiency of the government machinery (from third to fifth).

On the other hand, the state climbed from fourth to second place in the environmental sustainability category by improving urban services, waste disposal, and sewage treatment indicators. São Paulo remained in second place in the market potential category and in fourth place in the human capital category because of its high score in relation to the economically active population (EAP), including higher education, labor productivity, and worker qualification.

Source: Agência Brasil

Read More from The Rio Times

The Rio Times · Power Map
See who really holds power in Latin America
Click to open the Power Map

Rotate for Best Experience

This report is optimized for landscape viewing. Rotate your phone for the full experience.