Key Facts
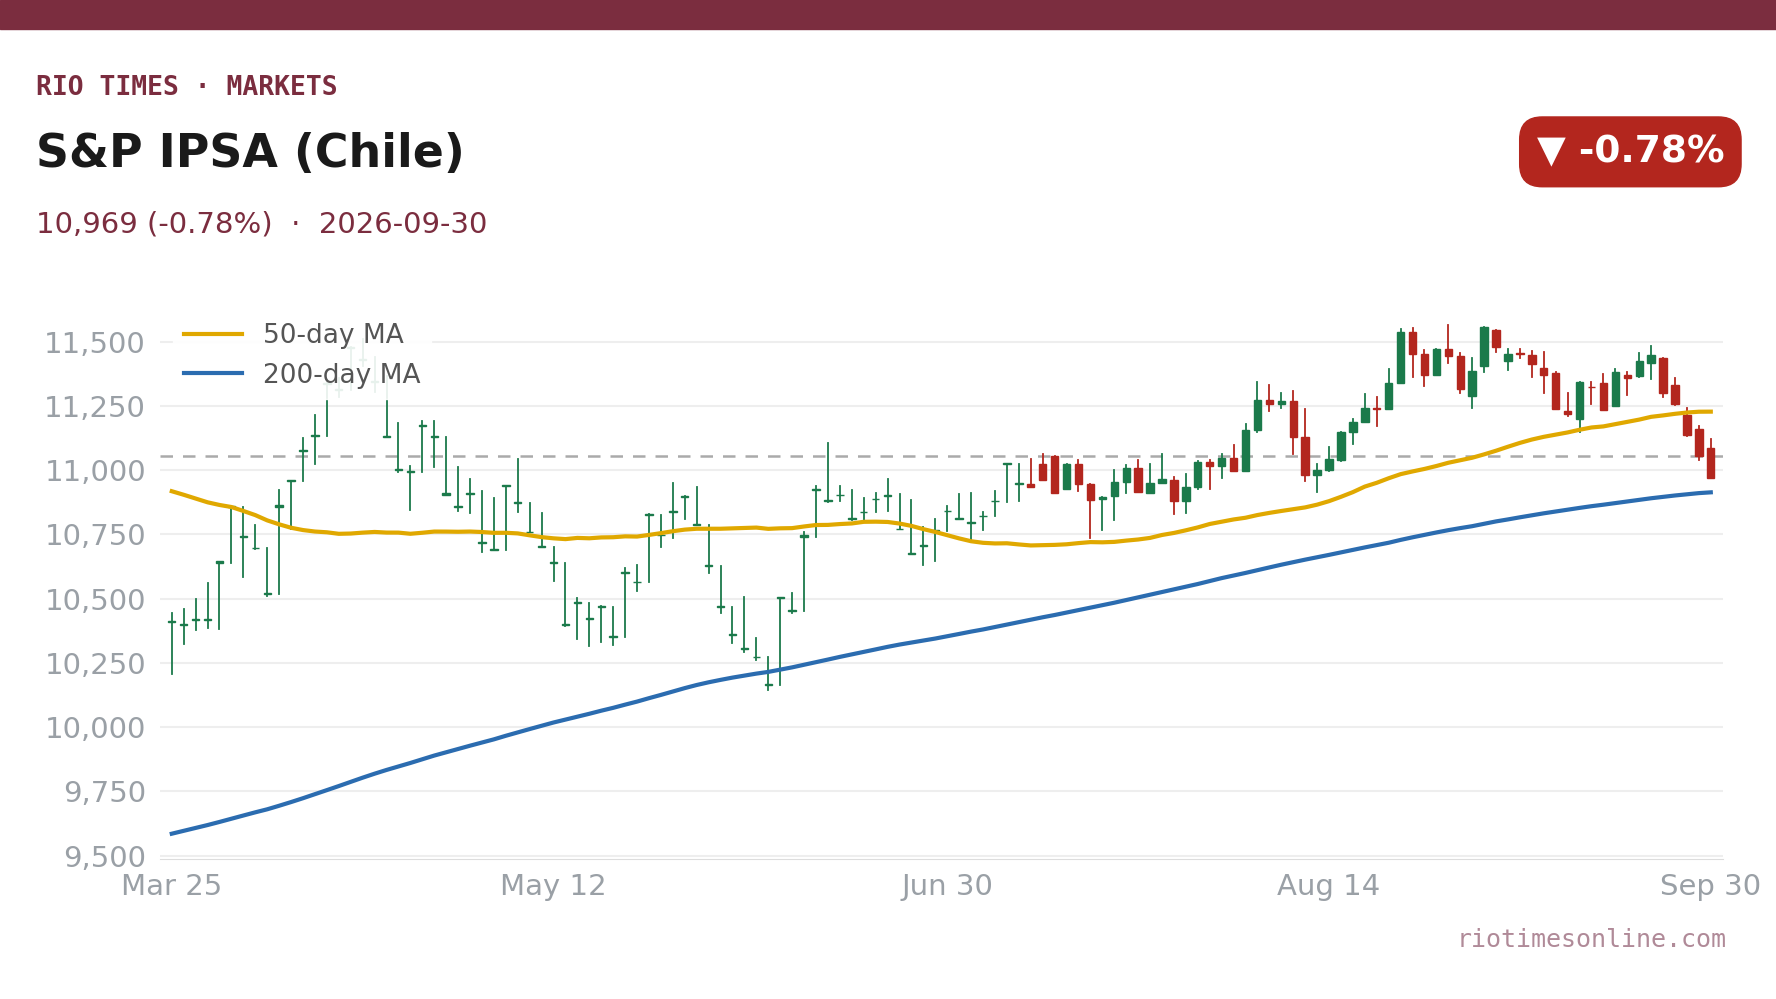
- The S&P IPSA, Chile’s main stock index, fell 0.78% to 10,969.49 on Wednesday, 30 September. It was the index’s fifth straight loss and its lowest close since 29 July, and it finished at the day’s low.
- September ended 3.06% lower, but the third quarter still closed 1.20% up. The index sits 5.7% below its 52-week closing high of 11,627.58 from 28 January.
- Weak local data were the main driver. Unemployment rose to 9.6% in June–August, industrial output fell 5.7% in August and copper production dropped 12.8% to its lowest monthly level since February 2011.
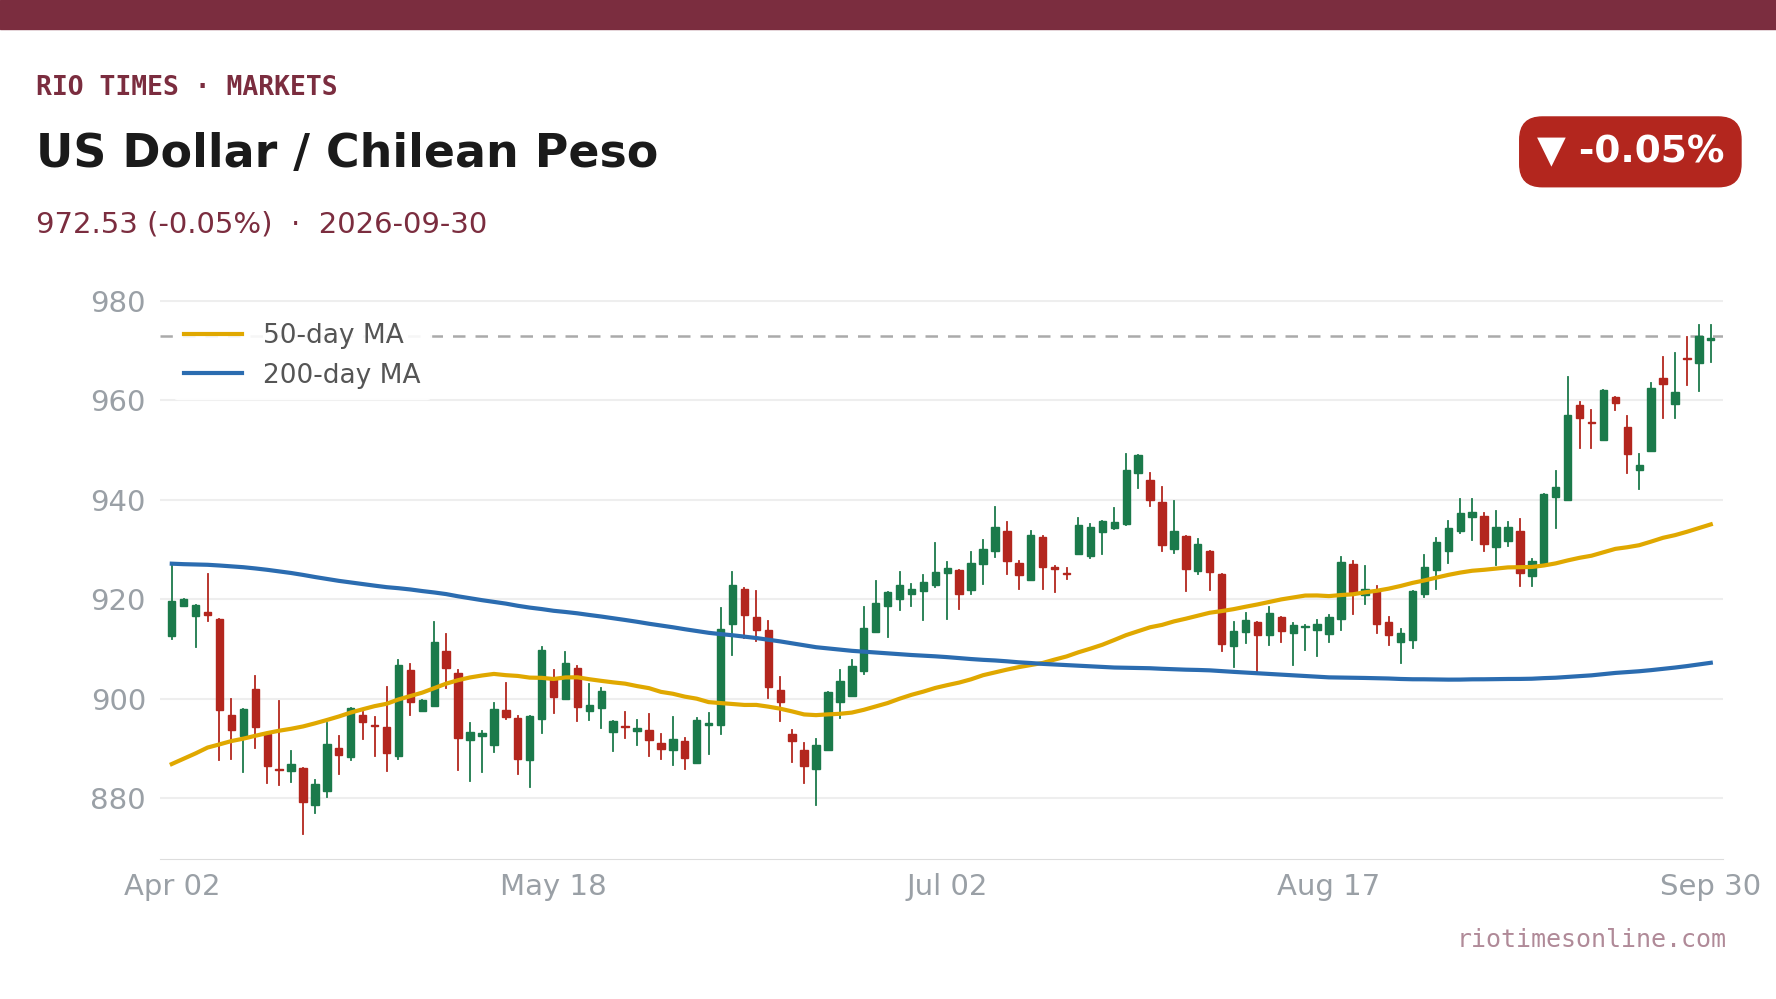
- The peso was steady at 972.53 per US dollar, up 0.05%, just off Tuesday’s weakest close in more than a year. It lost about 4% against the dollar in September.
- Lithium producer SQM-B fell 2.47%, mall owners Parque Arauco and Cencosud Shopping lost 3.44% and 2.90%, while fuel distributor Copec rose 1.29% and retailer Falabella 1.20%.
Today’s Focus
Chile’s stock market finished September on a weak note. The S&P IPSA, the benchmark of the Santiago exchange, fell 0.78% to 10,969.49 on Wednesday, 30 September.
It was the fifth loss in a row. The index opened near 11,086, touched 11,120, then slid to close at its low.
A batch of weak local data set the tone. The national statistics office, INE, said unemployment rose to 9.6% in June–August, the highest in about five years. Industrial output fell 5.7% in August, and copper production sank 12.8%.
The peso held steady at 972.53 per US dollar, a 0.05% gain, after Tuesday’s weakest close in more than a year. On Wednesday, President José Antonio Kast’s government also sent its 2027 budget to Congress, with spending set to grow 1.5% in real terms.
What matters today. The August Imacec economic activity index, due this morning, will show how deep the slowdown runs.

01 The session in one read
Chilean stocks closed out the quarter on a soft note. The S&P IPSA, which tracks about 30 of Santiago’s biggest and most-traded companies, fell 0.78% to 10,969.49.
That was the lowest close since 29 July. It left the index 5.7% below its 52-week closing high of 11,627.58, set on 28 January.
The IPSA lost 3.06% in September. Over the third quarter it still gained 1.20%, and it is about 4.7% higher than at the end of 2025.
The peso was steady. It closed at 972.53 per US dollar, 0.05% stronger than Tuesday’s 972.98, which was its weakest close in more than a year.
The data point to an economy that is losing speed. Joblessness is rising, mining output is falling and industry is shrinking, even as shoppers keep spending.
That mix weighs on banks, mall owners and drinks makers that live off domestic demand. It also hurts the peso, because copper exports are the country’s main source of dollars.
Copper prices offered little help, edging up only about 0.2% on the day. The variable to watch is Thursday’s Imacec: another decline would confirm that the economy shrank in August.
02 The day’s numbers
| Measure | Level | Change | Read |
|---|---|---|---|
| S&P IPSA | 10,969.49 | −0.78% | Fifth straight loss; lowest close since 29 July |
| Session range | 10,969–11,120 | n/a | Closed at the day’s low |
| IPSA in September / Q3 | −3.06% | +1.20% Q3 | 5.7% below the 28 January high |
| USD/CLP | 972.53 | −0.05% | Just off Tuesday’s one-year low for the peso |
| Copper (Comex) | about US$6.56/lb | +0.2% | Little support for the peso |
The session range tells the story. The IPSA traded above 11,100 in the morning but could not hold it, and the selling ran to the close.
The peso’s small gain does not change the trend. The dollar rose about 4% against the peso in September and about 5% over the quarter.
Live Market IntelligenceChile — Live Market Board
Rio Times · Live Market Intelligence
Chile — Live Market Board
| Instrument | Last | Change | YoY | Prev. | High | Low | Volume |
|---|---|---|---|---|---|---|---|
| IPSA | 10,908.18 | -0.56% | — | 10,969.49 | 11,210 | 10,984 | 1,513,213,483 |
| USD/CLP | 913.98 | +0.04% | -5.67% | 913.65 | 915.11 | 906.68 | — |
| COPPER | 6.61 | +0.03% | +46.70% | 6.61 | 6.71 | 6.61 | 39,543 |
| SQM-B | 65,305 | -0.84% | +49.03% | 65,860 | 66,949 | 64,978 | 76,539 |
| COPEC | 5,964 | -1.09% | -11.70% | 6,030 | 6,100 | 5,960 | 634,331 |
| BSANTANDER | 78.37 | -2.28% | +35.94% | 80.20 | 81.69 | 78.34 | 36,288,711 |
| FALABELLA | 6,334 | -1.48% | +23.28% | 6,429 | 6,450 | 6,300 | 26,085,814 |
| ENELAM | 87.09 | +0.10% | -10.13% | 87.00 | 87.40 | 86.50 | 13,106,417 |
| CENCOSUD | 1,946 | -2.19% | -35.30% | 1,990 | 2,010 | 1,945 | 966,528 |
| CMPC | 1,020 | -1.96% | -29.10% | 1,040 | 1,050 | 1,015 | 3,526,677 |
| BANCO CHILE | 184.96 | -1.01% | +32.87% | 186.85 | 189.99 | 184.33 | 18,101,240 |
| LATAM AIR | 24.08 | -1.11% | +16.61% | 24.35 | 24.59 | 23.88 | 573,612,753 |
| SOUTHERN COPPER | 193.97 | -0.26% | +104.01% | 194.48 | 199.36 | 192.59 | 367,102 |
03 Why it moved: weak data and domestic caution
The main driver was a run of weak figures from the INE, published before the market opened.
Unemployment rose to 9.6% in the June–August period, above the 9.5% expected and up one percentage point from a year earlier. The number of people in work fell 0.9%.
Industrial production fell 5.7% on the year in August, much worse than the 3.0% drop expected. Mining output fell 11.7%, and copper production slid 12.8% to 369,500 tonnes, its lowest monthly level since February 2011. In July, storms in the north had already forced mine shutdowns.
Shares tied to the local economy took the brunt. Mall owners Parque Arauco and Cencosud Shopping fell 3.44% and 2.90%, brewer CCU lost 2.28%, and banks BCI and Itaú Chile slipped 1.22% and 1.19%.
Retail sales were the bright spot, rising 3.4% on the year against 2.0% expected. Falabella, the department-store group, gained 1.20%.
04 The day’s movers
| Driver | Level / Move | Change | Note |
|---|---|---|---|
| SQM-B | Lithium | −2.47% | Erased Tuesday’s gain |
| Parque Arauco | Shopping malls | −3.44% | Biggest large-cap fall |
| Cencosud Shopping | Shopping malls | −2.90% | Domestic demand worries |
| CCU | Beverages | −2.28% | Consumer names under pressure |
| LATAM Airlines | Airline | −1.82% | Among the heavier large-cap falls |
| BCI / Itaú Chile | Banks | −1.22% / −1.19% | Rising unemployment weighs |
| Copec | Fuel and forestry | +1.29% | Rebounded after Tuesday’s fall |
| Falabella | Retail | +1.20% | Retail sales beat forecasts |
| CAP / CMPC | Iron ore / pulp | +0.99% / +0.98% | Exporters held up |
The pattern was clear. Companies that depend on Chilean consumers and credit fell, while some exporters and the retailer with the strongest sales news rose.
SQM-B was the notable large-cap loser after its gain on Tuesday. Banco de Chile, which fell 2.8% on Tuesday, eased a further 0.27%.
05 The regional scoreboard
| Index | Country | Change |
|---|---|---|
| S&P IPSA | Chile | −0.78% |
| Ibovespa | Brazil | +1.37% |
| S&P/BMV IPC | Mexico | −1.38% |
| S&P Merval | Argentina | +0.00% |
| MSCI COLCAP | Colombia | −0.38% |
Latin America was split on Wednesday. Brazil’s Ibovespa rose 1.37% and Argentina’s Merval 1.32%, while Mexico’s IPC fell 1.38% and Colombia’s COLCAP 0.38%.
Chile’s fall was driven by its own data rather than a region-wide retreat. Mexico had its own problem, a weak peso, and Colombia’s central bank raised rates by surprise.
06 The technical picture
The IPSA finished at 10,969.49, below the 11,000 mark and 5.7% beneath its 52-week closing high of 11,627.58. The next reference below is the late-July low near 10,936.
Closing at the session low after five losses in a row shows sellers in control. A close back above 11,100 would be the first sign of a turn.
For the peso, Tuesday’s 972.98 per US dollar is the line to watch. It is the weakest close in more than a year, and a break above it would mean a new low for the peso.
07 Wednesday’s data, one by one
Our previous edition told readers to watch Chile’s August data from the INE, the 2027 budget bill, China’s factory surveys, US data and the mediation at the Centinela copper mine.
- Unemployment (June–August): 9.6%, above the 9.5% expected and the 9.5% of the previous period. It is one point higher than a year earlier and, according to EFE, the highest in five years. Bank and consumer shares fell.
- Industrial production (August): down 5.7% on the year, against a 3.0% drop expected and 5.1% in July. Mining fell 11.7%, manufacturing 2.6% (1.7% expected) and electricity, gas and water rose 1.0%.
- Copper production (August): 369,500 tonnes, down 12.8% on the year after a 9.4% fall in July. It was the lowest monthly output since February 2011. Copper prices barely moved.
- Retail sales (August): the INE’s retail activity index rose 3.4% on the year, above the 2.0% expected, and up 1.2% on the month after seasonal adjustment. Total commerce activity, which also covers wholesale and vehicle trade, was flat at 0.0%, and supermarket sales fell 1.2%. Falabella rose.
- 2027 budget: the government sent the bill to Congress on Wednesday with real spending growth of 1.5%, as announced. President Kast presented it in a national broadcast.
- China PMIs (September): the official manufacturing index rose to 50.1 from 49.8, as expected, a modest support for copper demand.
- US data: ADP payrolls rose 90,000, above forecasts; core PCE inflation was 3.0%, below the 3.3% expected; second-quarter growth was revised up to 2.2%; and the Chicago PMI jumped to 58.8. The US ten-year yield rose to 5.29%.
- Centinela: we found no report of a deal or a strike at Antofagasta Minerals’ Centinela mine on Wednesday.
08 What to watch
- Imacec (August, 11:30 UTC): the central bank’s monthly activity index, expected at −0.4% on the year after −1.5% in July. A deeper fall would add to recession worries.
- 2027 budget debate: how lawmakers react to the 1.5% spending increase as the bill starts its passage through Congress.
- US ISM manufacturing (September, 14:00 UTC): forecast at 55; a strong reading would keep US yields high and the dollar firm.
- China’s Golden Week: mainland Chinese markets are closed from 1 to 7 October, which usually thins copper trading.
- Peso near 973: whether the currency breaks past Tuesday’s 972.98 per US dollar, its weakest close in more than a year.
Background: Chile’s Market Shuts for Fiestas Patrias as the Peso Ends the Week Weaker.
Frequently Asked Questions
What is the S&P IPSA?
It is Chile’s main stock index, tracking about 30 of the largest and most actively traded companies listed on the Santiago exchange.
Why did Chilean stocks fall on Wednesday?
Weak official data weighed on shares tied to the local economy. Unemployment rose to 9.6%, industrial output fell 5.7% and copper production dropped 12.8%. The IPSA fell 0.78% to 10,969.49, its fifth straight loss.
How did the peso do?
The peso was steady at 972.53 per US dollar, 0.05% firmer, after Tuesday’s weakest close in more than a year. It lost about 4% against the dollar in September.
Did anything rise?
Yes. Fuel distributor Copec gained 1.29% and retailer Falabella 1.20%, on a day when retail sales beat forecasts.
Source: RT live market data, close of Wednesday 30 September 2026; exchange figures from Bolsa de Santiago; economic data from the INE.
This article was produced by The Rio Times’ automated newsroom system. How we use AI · Report an error
LatAm Markets: Live Signals → — real-time movers, turnover leaders and FX across Latin America.
Read More from The Rio Times