Key Facts
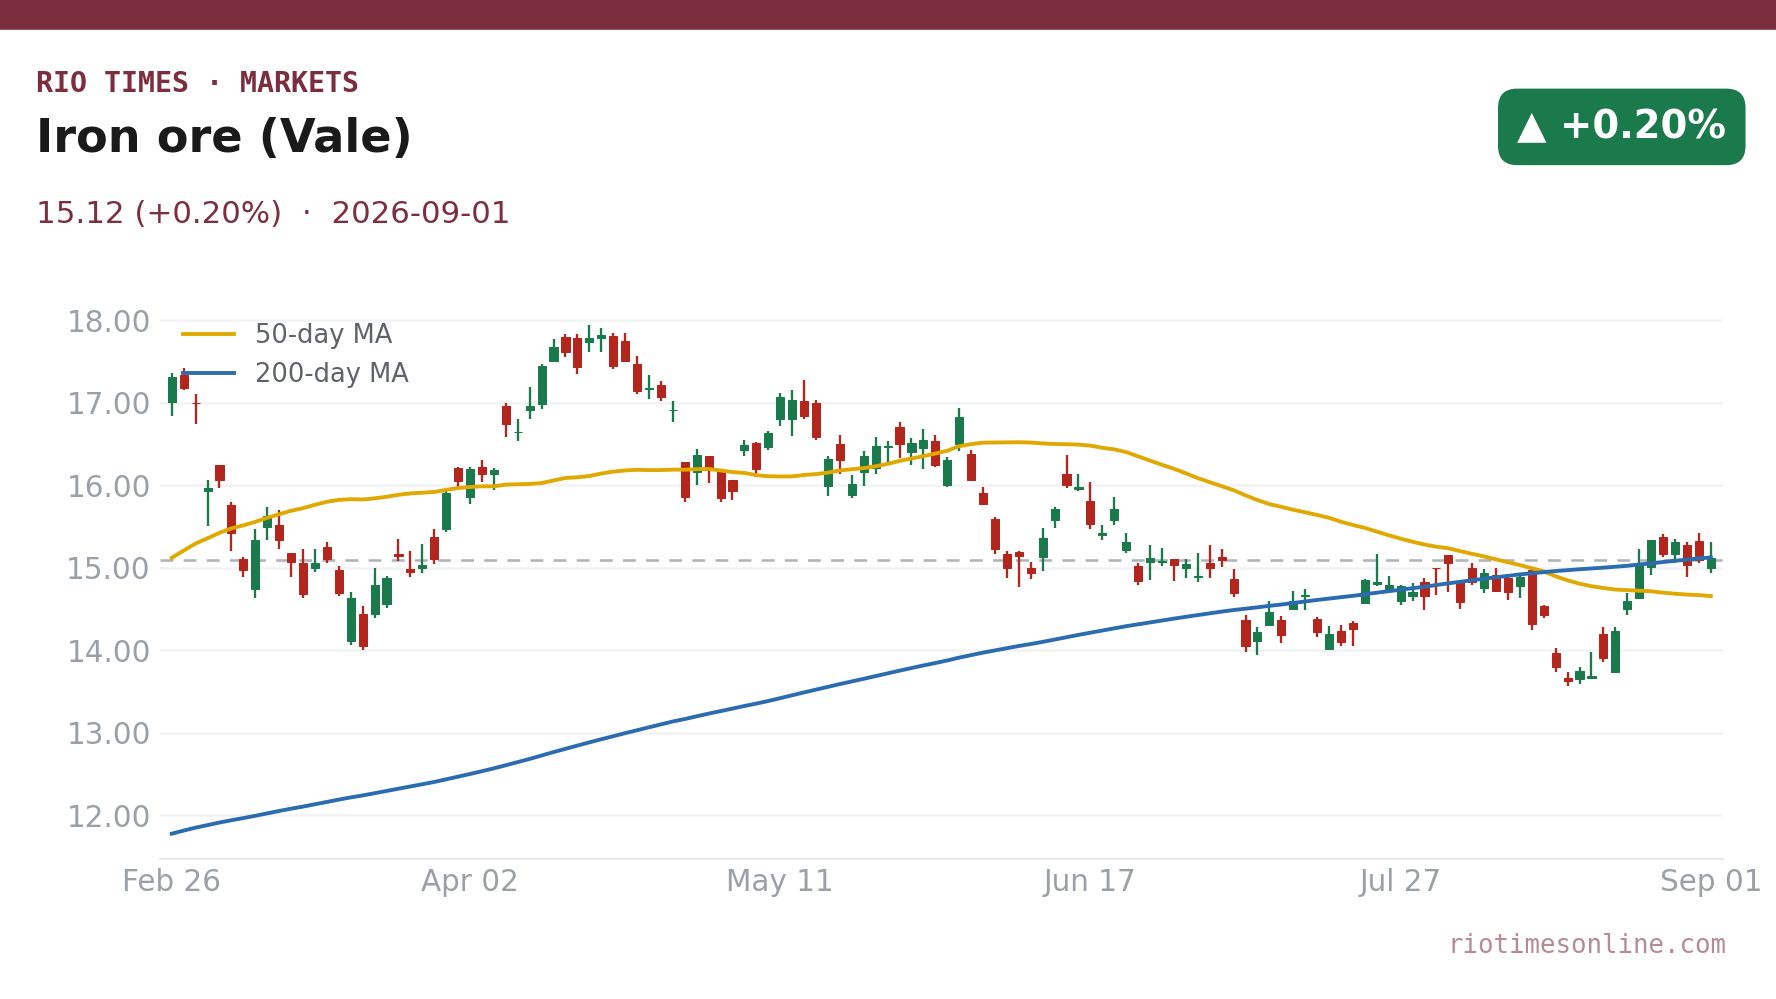
- Vale shares rose 0.20% to US$15.12 in New York trading on Tuesday, while Rio Tinto eased 0.62% to US$101.86 and CSN Mineração jumped 2.70% to R$6.08 in São Paulo.
- The 62% iron ore benchmark for delivery into China settled at US$95.84 per tonne, up a modest 0.17% on the day.
- China’s Dalian iron ore contract closed at 727 yuan per tonne, up 0.76%, with port-side spot prices firming 3–5 yuan as mills replenished inventories.
- Vale lifted its 2026 C1 cash cost guidance to US$22.50–US$23.50 per ton from US$20–US$21.50, and raised all-in costs to US$58–US$62 per ton.
- China’s steel output fell 3.6% in July from a year earlier to 76.93 million metric tons, and the seven-month total of 577.04 million tons was down 3.1%.
- China buys around 75% of global seaborne iron ore but prices have traded between US$93 and US$100 a ton since June, showing weak end-user steel demand.
Today’s Focus
Iron ore proxies finished mixed on Tuesday, September 1, 2026. Vale’s New York shares added 0.20% to US$15.12, CSN Mineração climbed 2.70% to R$6.08, and Rio Tinto slipped 0.62% to US$101.86.
The 62% grade benchmark for delivery into China settled up 0.17% at US$95.84 per tonne. Dalian futures gained 0.76% to 727 yuan, with port-side spot ore firming 3–5 yuan.
The day’s move was restocking-driven: steelmakers were topping up inventories, not responding to a real jump in steel consumption. China’s July steel output of 76.93 million metric tons was down 3.6% year on year.
Vale has told investors that stronger steel production outside China is offsetting softer domestic conditions, but the miner also raised its 2026 cash cost guidance by US$2.50 per ton.
What matters today. The iron ore market is being supported by Chinese mill restocking, but flat steel output and rising Vale costs keep the ceiling low.

01 The session in one read
Iron ore proxies ended Tuesday, September 1, 2026 on a mixed note, with Vale’s New York shares up 0.20% at US$15.12 and Rio Tinto down 0.62% at US$101.86. CSN Mineração was the standout, jumping 2.70% to R$6.08 in São Paulo.
The 62% iron ore benchmark for delivery into China settled at US$95.84 per tonne, up 0.17%. Dalian’s most-traded contract closed up 0.76% at 727 yuan per tonne, with port-side spot mainstream ore gaining 3–5 yuan.
Buying was tied to restocking: Chinese steelmakers were replenishing inventories rather than responding to a strong pickup in end-user steel consumption. That keeps the market supported but not convincingly bullish.
Iron ore proxies are trading sideways because mills are buying for inventory, not for a surge in construction or manufacturing orders. The benchmark has been stuck between US$93 and US$100 per ton since June, and China’s steel output fell 3.6 percent in July to 76.93 million metric tons.
Vale’s higher cost guidance — C1 cash costs of US$22.50 to US$23.50 per ton and all-in costs of US$58 to US$62 — will squeeze margins if the demand recovery stalls. Watch China’s weekly steel production data.
02 The board
Vale’s New York shares, the closest listed proxy for Brazilian iron ore exposure, rose 0.20% to US$15.12. The move tracked the modest gain in the China benchmark and outweighed a softer day for Rio Tinto, which slipped 0.62% to US$101.86.
CSN Mineração outgained its peers, climbing 2.70% to R$6.08. The divergence among proxies reflects different investor bases and liquidity rather than a gap in the underlying ore narrative.
| Asset | Level | Change |
|---|---|---|
| Iron ore (Vale) | US$15.12 | +0.20% |
| CSN Mineração | R$6.08 | +2.70% |
| Rio Tinto | US$101.86 | -0.62% |
Source: RT close, 2026-09-01. Where a commodity has no spot feed, an exchange-traded tracker or leading producer is shown as a labelled proxy.
Live Market IntelligenceThe live market board
Rio Times · Live Market Intelligence
Latin America — Cross-Market Board
| Instrument | Last | Change | YoY | Prev. | High | Low | Volume |
|---|---|---|---|---|---|---|---|
| IBOV | 185,483.42 | +3.21% | +21.85% | 179,722.48 | 168,310 | 167,142 | — |
| IPSA | 11,315.26 | -1.14% | — | 11,445.90 | 11,210 | 10,984 | 1,513,213,483 |
| IPC MEX | 64,838.57 | +0.50% | +12.17% | 64,514.25 | 66,121 | 65,405 | 108,886,187 |
| MERVAL | 3,057,915 | +0.28% | +30.51% | 3,022,485 | 3,042,365 | 2,991,150 | — |
| COLCAP | 2,483.01 | +0.52% | — | 9.04 | 9.05 | 9.02 | 4,133 |
| BVL PERÚ | 59,515.48 | +0.86% | — | — | — | — | — |
| USD/BRL | 5.16 | +0.01% | -5.13% | 5.16 | 5.18 | 5.14 | — |
| EUR/BRL | 5.95 | +1.01% | -5.83% | 5.89 | 5.98 | 5.94 | — |
| USD/MXN | 17.06 | -0.24% | -8.58% | 17.10 | 17.08 | 17.01 | — |
| USD/CLP | 913.98 | +0.04% | -5.67% | 913.65 | 915.11 | 906.68 | — |
| USD/COP | 3,140 | +0.03% | -22.04% | 3,139 | 3,141 | 3,105 | — |
| USD/PEN | 3.36 | -0.66% | -4.82% | 3.38 | 3.38 | 3.35 | — |
| USD/ARS | 1,493 | +0.10% | +12.96% | 1,491 | 1,494 | 1,480 | — |
| USD/UYU | 40.27 | +1.24% | +1.80% | 39.77 | 40.27 | 40.23 | — |
| USD/PYG | 5,939 | +1.68% | -19.54% | 5,841 | 5,939 | 5,925 | — |
| USD/BOB | 11.64 | -0.76% | +72.04% | 11.73 | 11.72 | 11.64 | — |
| USD/DOP | 58.34 | +1.25% | -3.44% | 57.62 | 58.34 | 58.04 | — |
| USD/CRC | 445.92 | +0.89% | -9.71% | 441.97 | 448.50 | 445.92 | — |
Live Company IntelligenceVale SA ADR — the full investor dossier
Wall Street view
Valuation & profitability
Price & risk
$9.3952-wk high
$17.44
Revenue trend · 6y
Ownership
Dividend
03 What moved it
The driver was restocking demand from Chinese steel mills. Port-side spot prices firmed 3–5 yuan and Dalian futures rose 0.76% to 727 yuan per tonne, but traders read the buying as inventory replenishment rather than a rebound in construction or manufacturing orders.
China buys around 75% of global seaborne iron ore, so its steel arithmetic sets the tone globally. Yet the benchmark has stayed between US$93 and US$100 per ton since June, a sign of soft end-user demand.
China’s steel output fell 3.6% in July to 76.93 million metric tons, and the first seven months of 2026 brought 577.04 million tons, down 3.1% year on year. Outside China, steel production is firmer, which Vale says is offsetting domestic softness.
04 The Latin American read
For Brazil, the iron ore price matters through Vale and CSN Mineração dividends, cash flow and investment plans. Vale’s share move of 0.20% in New York was calm, but the miner’s cost revisions loom larger for Latin American investors.
Vale raised its 2026 C1 cash cost guidance to US$22.50 to US$23.50 per ton, up from US$20 to US$21.50. Its all-in cost guidance also moved to US$58 to US$62 per ton from US$52 to US$56.
Those higher costs shrink the buffer if China’s restocking fades. With global pig iron production broadly stable, Vale is banking on stronger steel output outside China to defend volumes.
05 The names to watch
Vale is the obvious one: its New York shares closed at US$15.12, up 0.20%, and its cost guidance will steer margin expectations for the rest of 2026.
Rio Tinto’s 0.62% dip to US$101.86 shows Australian producers responding to the same weak Chinese demand signals. CSN Mineração’s 2.70% jump to R$6.08 makes it the high-sensitivity play in Brazilian shares on the ore price.
China’s Dalian futures, which rose 0.76% to 727 yuan per tonne, remain the best real-time gauge of short-term sentiment among Chinese traders.
06 The outlook
The benchmark is likely to stay range-bound while China’s mills restock without a visible pickup in construction or manufacturing steel use. The 62% grade at US$95.84 per tonne sits near the middle of its US$93–US$100 trading band since June.
Vale’s higher cost guidance raises the bar for its earnings even if prices hold. If Chinese steel output continues to fall, the restocking bid may prove short-lived and pressure the proxies again.
07 What to watch
- China steel output: Weekly production data will show whether restocking is turning into real steel demand or just inventory building.
- Vale cost execution: The raised C1 cash cost guidance of US$22.50–US$23.50 per ton will be tested in the next quarterly report.
- Benchmark range: Whether the 62% grade holds its US$93–US$100 per ton band or breaks out will set the tone for Brazilian miners.
- Iron ore inventory data: Port-side stockpiles in China will confirm if the 3–5 yuan spot gain reflects genuine consumption or speculative buying.
Frequently Asked Questions
Why did Vale rise while Rio Tinto fell?
Vale shares added 0.20% to US$15.12 on Tuesday, while Rio Tinto slipped 0.62% to US$101.86, reflecting different investor bases rather than a divided ore story.
Is China’s steel demand recovering?
Not yet. China’s July steel output of 76.93 million metric tons was down 3.6% year on year, and the seven-month total fell 3.1% to 577.04 million tons.
What does Vale’s higher cost guidance mean?
Vale raised its 2026 C1 cash cost guidance to US$22.50–US$23.50 per ton and all-in costs to US$58–US$62 per ton, squeezing margins if prices stall.
Why does China matter so much for iron ore?
China buys around 75% of global seaborne iron ore, so its steel output and mill restocking cycles drive the benchmark price.
Market data: RT
This article was produced by The Rio Times’ automated newsroom system. How we use AI · Report an error
LatAm Markets: Live Signals → — real-time movers, turnover leaders and FX across Latin America.
Read More from The Rio Times